Peptide Quality Standards & Analytical Methods: A Complete Laboratory Guide for Research Peptide Verification
HPLC, Mass Spectrometry, Endotoxin Testing, Stability Analysis, and Supplier Audit Protocols — Updated 2026
TL;DR — Key Takeaways
- Peptide quality verification is the single most important step in ensuring reproducible research — incomplete or unreliable analytical data compromises experimental validity regardless of how well the downstream protocol is executed.
- HPLC purity ≥98% (C18, 214 nm) is the minimum standard for research-grade peptides; for multi-component blends such as the KLOW formulation, each individual peptide should be ≥99% pure before blending.
- Purity ≠ peptide content. A peptide reported as 99% pure by HPLC may contain only 70–90% actual peptide by weight due to counterions (TFA, acetate) and residual water — amino acid analysis (AAA) is the gold standard for true peptide content.
- Certificate of Analysis (COA) must include HPLC trace, ESI-MS spectrum, LAL endotoxin result, residual TFA, Karl Fischer water content, and appearance — a COA missing any of these is incomplete and insufficient for due diligence.
- Endotoxin testing (kinetic chromogenic LAL, <0.1 EU/μg) is non-negotiable for cell-based research — even trace LPS activates TLR4/NF-κB and confounds gene expression, cytokine, and functional readouts.
- Mass spectrometry identity confirmation via ESI-MS (monoisotopic [M+H]⁺ ±1.0 Da) or LC-MS/MS sequencing is required to distinguish the target peptide from deletion sequences, truncation products, and isobaric byproducts.
- Third-party verification by an ISO/IEC 17025-accredited laboratory should be commissioned whenever the supplier’s COA is incomplete, the supplier is unestablished, or experimental results show unexpected variability.
- This guide provides instrument-specific method parameters (Agilent 1260, Waters Xevo Q-TOF, Thermo Q Exactive, Lonza Kinetic-QCL, Dionex ICS, Mettler Toledo KF) and serves as both a laboratory manual and a supplier audit framework.
Table of Contents
- 3.1 RP-HPLC Principles for Peptides
- 3.2 Method Parameters
- 3.3 Interpreting HPLC Traces
- 3.4 Multi-Component Blend HPLC
- 4.1 ESI-MS Principles and Parameters
- 4.2 Expected Masses for KLOW Components
- 4.3 LC-MS/MS for Peptide Sequencing
- 4.4 High-Resolution Mass Spectrometry (HRMS)
- 6.1 TFA Analysis by Ion Chromatography
- 6.2 Water Content by Karl Fischer Titration
- 6.3 Residual Solvents and Counterions
- Amino Acid Analysis (AAA)
- Peptide Stability Testing
- Batch Consistency & Supplier Quality Systems
- Third-Party Testing vs. Manufacturer COA
- Frequently Asked Questions
- Entity Glossary
- References
- Further Reading on RPL Peptides
- Related Research Guides
1. The Quality Assurance Framework for Research Peptides
1.1 The Analytical Reality of Research Peptides
Every peptide researcher eventually confronts the same uncomfortable truth: the labeled mass in the vial is not the peptide mass in solution. A vial labeled “10 mg BPC-157” delivered by a reputable supplier may contain 7–8 mg of actual peptide — the remainder is counterion (TFA, acetate), residual water, and minor process-related impurities. This is not a quality defect; it is a universal physicochemical reality of lyophilized synthetic peptides. But failing to account for it introduces systematic error of 10–30% into every concentration-dependent experiment.
The quality assurance framework for research peptides exists to answer five fundamental questions about every batch:
| Question | Analytical Method | Acceptance Criterion |
|---|---|---|
| Is the peptide chain intact and correct? | RP-HPLC (C18, 214 nm) | ≥98% main peak area |
| Does the mass match the expected sequence? | ESI-MS, HRMS, LC-MS/MS | [M+H]⁺ ±1.0 Da (unit resolution); ±5 ppm (HRMS) |
| Is it free of endotoxin contamination? | Kinetic chromogenic LAL | <0.1 EU/μg (research grade) |
| What is the actual net peptide content? | Amino acid analysis (AAA) | Reported as % w/w |
| How much counterion and water is present? | Ion chromatography (TFA), Karl Fischer (H₂O) | TFA <1.0%, H₂O <5% |
These five questions, answered rigorously and batch-specifically, constitute the minimum viable quality framework. Suppliers that cannot answer all five — or that answer only some, relying on generic “≥98%” claims without supporting data — introduce unquantified risk into the research supply chain. For a comprehensive overview of what quality control entails at each manufacturing stage, see the peptide quality control central resource covering HPLC purity, LC-MS, amino acid analysis, impurity profiling, and stability testing across GMP and research-grade production.
1.2 GMP vs. Research-Grade: A Critical Distinction
The term “GMP” (Good Manufacturing Practice) is frequently invoked in peptide marketing — often without qualification. For clarity:
| Attribute | GMP Peptide | Research-Grade Peptide |
|---|---|---|
| Regulatory framework | 21 CFR 210/211 (US), EudraLex Vol. 4 (EU), or ICH Q7 | None; supplier-defined SOPs |
| Quality system | ISO 13485 or equivalent with certified QMS | May be ISO 9001 or informal SOP-based |
| Batch record traceability | Full traceability from raw material to finished product | Variable; often minimal |
| Stability program | ICH Q1A-compliant (forced degradation, accelerated, real-time) | May be limited to COA snapshot |
| Audit trail | Complete, GxP-compliant electronic records | Not required |
| Cost multiplier | 5–20× research-grade pricing | Baseline pricing |
| Appropriate for | Regulatory submissions, clinical trial material, pharmaceutical development | Academic research, in vitro experimentation, method development |
Bottom line for laboratory scientists: Research-grade peptides produced under an ISO 9001 quality management system with full COA documentation (HPLC + MS + LAL + TFA + KF + AAA) are sufficient for virtually all in vitro research. GMP peptides are only necessary when the work feeds into a regulatory submission. The analytical methods described in this guide apply to both grades — the difference is the formality of the quality system surrounding execution, not the fundamental analytical chemistry. For researchers procuring peptides at scale, the custom peptide synthesis and OEM manufacturing quality standards guide covers SPPS protocols, bulk purification, and quality benchmarks relevant to large-quantity procurement.
1.3 Pharmacopoeial Context: USP, EP, and JP
The major pharmacopoeias (USP, EP, JP) publish monographs for approved peptide drug substances (e.g., synthetic teriparatide, calcitonin, insulin analogs) that specify identity, purity, impurity, and assay methods. Research peptides — including GHK-Cu, BPC-157, TB-500, and KPV as supplied for the KLOW research blend — are not pharmacopoeial articles. No official monograph exists.
However, the analytical methodology specified by the pharmacopoeias provides a useful reference framework:
- USP <621> Chromatography — system suitability parameters (resolution, tailing factor, plate count) that should be applied to HPLC purity methods
- USP <85> Bacterial Endotoxins Test — LAL assay methodology, interference testing, and acceptance criteria
- USP <921> Water Determination — Karl Fischer titration method validation
- EP 2.2.56 Amino Acid Analysis — hydrolysis, derivatization, and quantification parameters
- ICH Q2(R1) Validation of Analytical Procedures — accuracy, precision, specificity, LOD/LOQ, linearity, range
When commissioning third-party testing or developing in-house analytical methods, referencing these pharmacopoeial chapters provides a defensible methodological framework even for non-pharmacopoeial peptides.
1.4 ISO/IEC 17025: The Laboratory Accreditation Standard
ISO/IEC 17025:2017 is the international standard for testing and calibration laboratory competence. An ISO/IEC 17025-accredited analytical laboratory has demonstrated:
- Validated and documented analytical methods
- Proficiency testing and inter-laboratory comparisons
- Measurement uncertainty budgets for each assay
- Personnel competency records
- Equipment calibration and maintenance programs
- Independent third-party assessment of technical competence
When sending peptide samples for third-party verification, selecting an ISO/IEC 17025-accredited laboratory provides the highest confidence in analytical data integrity. Laboratories accredited by A2LA (US), UKAS (UK), or CNAS (China) to ISO/IEC 17025 with peptide analysis in their scope of accreditation represent the gold standard.
2. Certificate of Analysis (COA): Complete Guide
2.1 What a COA Should Contain
A complete, defensible Certificate of Analysis for a research peptide should contain the following elements at minimum. Each is explained with the rationale for why it matters:
2.1.1 Administrative Metadata
| Element | Required? | Rationale |
|---|---|---|
| Batch/Lot number | Yes | Enables traceability to synthesis records, raw materials, and QC data |
| Date of analysis | Yes | Establishes the COA’s temporal validity; stability data should be more recent for newer batches |
| Date of manufacture | Yes | Aging of the batch since synthesis has implications for stability |
| Analyst name/signature | Yes | Identifies the responsible QC professional |
| Product name and CAS number | Yes | Unambiguous identification of the peptide |
2.1.2 Analytical Data: The Non-Negotiable Minimum
| Test | Data Supplied | Acceptance Criterion | Why It Matters |
|---|---|---|---|
| HPLC Purity | Chromatogram with integration table (% area) | ≥98% main peak (research grade) | Confirms peptide chain integrity; detects deletion sequences and truncation products |
| ESI-MS | Mass spectrum with m/z annotation | [M+H]⁺ within ±1.0 Da of theoretical | Confirms molecular identity; rules out wrong-sequence synthesis errors |
| LAL Endotoxin | Endotoxin concentration (EU/mg) | <0.1 EU/μg (<0.01 EU/μg for cell-culture grade) | Prevents TLR4-mediated confounding in cell-based experiments |
| Residual TFA | % w/w TFA by ion chromatography | <1.0% | TFA is a known cellular stressor that can confound biological assays at high concentrations |
| Water Content | % w/w H₂O by Karl Fischer | <5.0% | Water content directly subtracts from net peptide content; excess moisture accelerates degradation |
| Net Peptide Content | % w/w by AAA or nitrogen analysis | Reported (typically 70–90%) | Enables accurate solution preparation; the most commonly overlooked parameter |
| Appearance | Visual description | White to off-white lyophilized powder/cake | Gross indicator of degradation (yellowing, collapse, clumping) |
2.1.3 Example: Elements of a Complete COA for KLOW Components
For each individual peptide in the KLOW blend — GHK-Cu, BPC-157, TB-500, and KPV — a complete COA should include:
- Individual HPLC trace at 214 nm with retention time, % area, and integration table
- ESI-MS spectrum confirming monoisotopic [M+H]⁺ (or multiply charged species for larger peptides)
- LAL endotoxin result in EU/mg
- TFA content by ion chromatography
- Water content by Karl Fischer titration
- Net peptide content by AAA (preferred) or elemental nitrogen analysis
- Peptide-specific specifications (e.g., copper content verification for GHK-Cu by ICP-MS or UV-Vis at 604 nm)
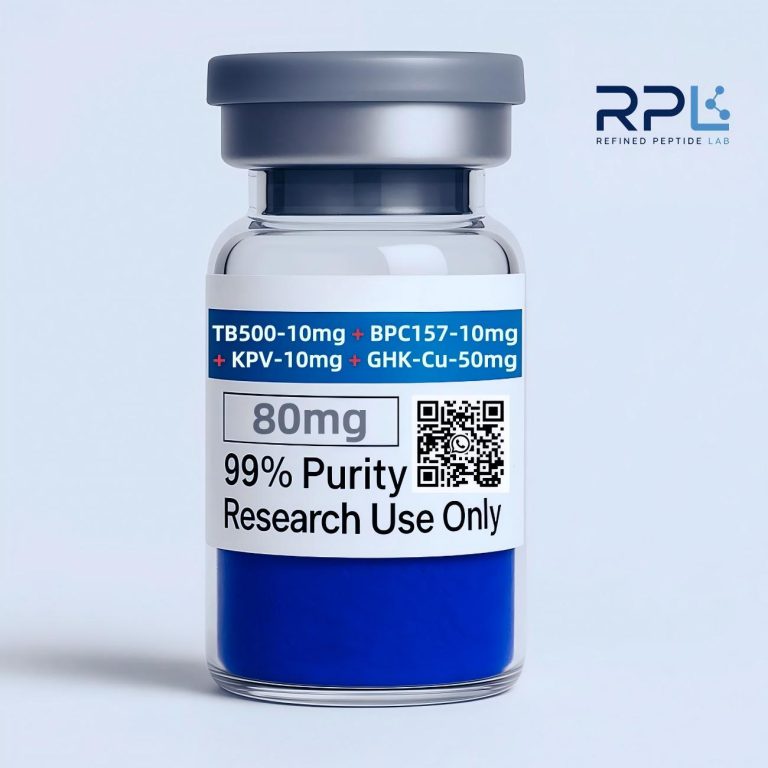
For examples of how these COAs appear for individual peptides, refer to the product-specific technical data on GHK-Cu COA, BPC-157 COA, TB-500 COA, and KPV COA. The complete KLOW blend product is available as KLOW80 research peptide.
2.2 How to Read a COA: Annotated Walkthrough
Reading a COA critically requires looking beyond the summary numbers. Below is a systematic approach to COA interpretation:
Step 1: Verify Chromatogram Integrity
Look at the actual chromatogram, not just the purity number. Check:
- Baseline stability: A drifting, noisy, or stepped baseline suggests detector, pump, or column problems — the integration may be unreliable.
- Peak symmetry: A tailing factor (USP Tf) >2.0 or fronting >1.5 indicates column deterioration, overload, or inappropriate mobile phase — integration of asymmetric peaks is method-dependent and less reproducible.
- Resolution from nearest impurity: If the main peak is not baseline-resolved (Rs ≥1.5) from adjacent impurity peaks, the purity percentage may be overestimated (co-elution).
- Integration markers: Verify that the integration start/end points are at baseline and not cutting through adjacent peaks. Manual integration can inflate or deflate purity by several percent.
- Scale of the y-axis: If the chromatogram is shown at a highly expanded scale that hides small impurities, request a full-scale (0–100% of main peak) trace.
Step 2: Verify Mass Spectrum Authenticity
- Signal-to-noise ratio: A weak, noisy spectrum may indicate insufficient sample concentration or ion suppression — request re-analysis at appropriate concentration.
- Isotopic distribution: For peptides above ~1,000 Da, the monoisotopic peak should be clearly resolved from the first isotope peak. A “blurred” isotopic envelope may indicate salt adducts, incomplete desalting, or poor instrument resolution.
- Adduct ions: Sodium (+22 Da), potassium (+38 Da), and TFA adducts are common. Their absence or presence should be consistent with the molecular formula.
- Multiply charged envelope: For peptides >1,500 Da (BPC-157, TB-500), look for the characteristic [M+2H]²⁺ and [M+3H]³⁺ charge states. Deconvolution should yield a consistent neutral mass.
Step 3: Verify Endotoxin Results
- Method specification: The COA should state the LAL method type (kinetic chromogenic, kinetic turbidimetric, or gel-clot) and lysate sensitivity (EU/mL).
- Positive product control (PPC): Spike recovery must be 50–200% for a valid assay. If not stated, the result is not interpretable.
- Dilution factor: Highly concentrated peptide solutions may inhibit the LAL reaction — the COA should state the dilution at which testing was performed and confirm absence of interference.
Step 4: Identify Red Flags
| Red Flag | Why It Matters |
|---|---|
| “>95%” purity with no chromatogram | Without the trace, the number is unverifiable |
| Purity reported at 220 nm only | 220 nm is less peptide-bond-specific than 214 nm; chromophoric impurities may be missed |
| ESI-MS spectrum without m/z axis labels | Uninterpretable — cannot confirm identity |
| No endotoxin result | Most common omission; renders the peptide unsafe for cell-based work |
| “TFA and water: report available on request” | If not on the COA, it was likely not tested — or results were unfavorable |
| Handwritten COA without analyst identity | No accountability; unverifiable |
| Generic purity claim (e.g., “>98%”) identical across multiple batches | Suspicious — batch-to-batch variability is normal and expected |
2.3 COA Limitations
Even a complete COA has fundamental limitations that researchers must understand:
- Single-batch snapshot: A COA represents one analytical characterization of one sample from one batch — it does not guarantee that every vial in that batch is identical (sub-sampling variability).
- Supplier-dependent: The data are generated by or on behalf of the supplier. Without third-party verification, the COA is a self-reported claim.
- No stability information: A COA characterizes the batch at a single time point, typically shortly after manufacture. It provides no information about stability over time.
- Method-dependence: HPLC purity is method-dependent — a different column chemistry, gradient, or detection wavelength can yield different results. “99% purity” without specifying method parameters is not a rigorous claim.
- No functional testing: COA analytical methods confirm identity and purity — they do not test biological activity, solubility, or any functional parameter.
3. HPLC Purity Analysis: Deep Technical
3.1 RP-HPLC Principles for Peptides
Reversed-phase high-performance liquid chromatography (RP-HPLC) is the universal first-line purity assessment for synthetic peptides. The principle: peptides are separated based on their differential hydrophobic interaction with a non-polar stationary phase (typically C18-bonded silica) under gradient elution with a water-acetonitrile mobile phase containing an ion-pairing agent (typically 0.1% trifluoroacetic acid, TFA).
Why C18?
Octadecylsilane (C18) bonded phase provides optimal retention for peptides in the MW range of ~200–5,000 Da. Shorter chains (C8, C4) provide insufficient retention for small, hydrophilic peptides. Longer chains (C30) provide excessive retention and poor peak shape for peptides.
Why TFA as Ion-Pairing Agent?
Trifluoroacetic acid (0.05–0.1% v/v) serves three functions simultaneously:
- Ion-pairing: The trifluoroacetate anion forms an ion pair with protonated basic residues (Lys, Arg, His, N-terminus), increasing their effective hydrophobicity and enhancing retention.
- pH control: Maintains mobile phase at pH ~2.0, ensuring all carboxyl groups (Asp, Glu, C-terminus) are protonated and all amino groups are positively charged — maximizing resolution.
- Peak shape: Suppresses silanol interactions on the silica support, reducing peak tailing for basic peptides.
Alternative ion-pairing agents: Formic acid (0.1%) is used for LC-MS applications where TFA causes ion suppression. Heptafluorobutyric acid (HFBA, 0.1%) provides stronger ion-pairing for very hydrophilic peptides but is difficult to remove from the column.
3.2 Method Parameters
Standard RP-HPLC Method for Research Peptides
The following parameters are validated for the Agilent 1260 Infinity II quaternary pump system with diode array detector (DAD), but are transferable to equivalent systems (Waters Alliance e2695, Shimadzu LC-20AD, Thermo UltiMate 3000):
| Parameter | Specification | Comments |
|---|---|---|
| Column | Phenomenex Kinetex C18, 5 μm, 250 × 4.6 mm | Core-shell technology for improved resolution; equivalent: Waters XBridge C18, Agilent Zorbax SB-C18 |
| Guard column | Phenomenex SecurityGuard C18, 4 × 2.0 mm | Protects analytical column; replace every ~200 injections |
| Mobile phase A | 0.1% TFA in HPLC-grade H₂O (v/v) | Filter through 0.22 μm membrane; degas by sonication or in-line vacuum degasser |
| Mobile phase B | 0.1% TFA in HPLC-grade acetonitrile (v/v) | ACN must be HPLC-grade (≥99.9%); UV cutoff 190 nm |
| Gradient | 5% B → 95% B over 30 min (linear) | 3% B/min ramp; hold at 95% B for 5 min for column wash; re-equilibrate at 5% B for 10 min |
| Flow rate | 1.0 mL/min | Typical for 4.6 mm i.d. columns; adjust proportionally for other diameters |
| Column temperature | 25 ± 1°C | Thermostatted column compartment required for retention time reproducibility |
| Detection wavelength | 214 nm (primary), 254 nm (secondary) | 214 nm = peptide bond n→π* transition; 254 nm = aromatic residues (Trp, Tyr, Phe) |
| Injection volume | 20 μL | For 1 mg/mL sample in mobile phase A or water |
| Sample concentration | 1.0 mg/mL | Adjust if peptide has low solubility or low UV extinction |
| Run time | 35 min (gradient) + 5 min (wash) + 10 min (re-equilibration) = 50 min total | Column equilibration is critical — insufficient equilibration causes retention time drift |
System Suitability Requirements
Before analyzing samples, perform system suitability testing:
| Parameter | Acceptance Criterion |
|---|---|
| Retention time reproducibility | RSD <1.0% (n=5 injections of standard) |
| Peak area reproducibility | RSD <2.0% (n=5) |
| USP tailing factor (Tf) | ≤2.0 at 5% peak height |
| USP plate count (N) | ≥10,000 theoretical plates |
| Resolution (Rs) between closest-eluting impurity pair | ≥1.5 |
Alternative Method: Rapid UHPLC for High-Throughput QC
For high-throughput QC environments, a UHPLC method can reduce analysis time:
| Parameter | Specification |
|---|---|
| Column | Phenomenex Kinetex C18, 1.7 μm, 100 × 2.1 mm |
| Flow rate | 0.4 mL/min |
| Gradient | 5% B → 95% B over 10 min |
| Injection volume | 2 μL |
| Run time | 10 min + 3 min wash + 3 min re-equilibration = 16 min total |
UHPLC achieves comparable resolution in ~30% of the time but requires a system rated for >600 bar backpressure.
3.3 Interpreting HPLC Traces
Peak Integration: The Most Operator-Dependent Step
Peak integration is where most HPLC purity discrepancies originate. Automated integration algorithms (Agilent ChemStation, Waters Empower, Thermo Chromeleon) must be configured consistently:
- Integration threshold: Set to capture peaks ≥0.05% of main peak area. Peaks below 0.05% are typically excluded from the purity calculation but should be visible in the raw trace.
- Baseline type: For gradient methods, a “valley-to-valley” baseline with peak-skimming for unresolved shoulders is standard. Tangent skimming typically underestimates impurity content.
- Minimum peak width: Set to ~0.2 min to avoid integrating baseline noise as peaks.
Diagnostic Peak Shapes
| Observation | Likely Cause | Corrective Action |
|---|---|---|
| Shoulder on main peak | Co-eluting impurity, partial diastereomer, or peptide with single amino acid deletion | Insufficient resolution — extend gradient or use shallower ramp; confirm by LC-MS |
| Fronting peak | Column overload, sample solvent stronger than initial mobile phase | Reduce injection mass; dissolve sample in weaker solvent (e.g., 95% A/5% B) |
| Tailing peak (Tf >2.0) | Silanol interactions (basic peptides), column deterioration, metal contamination | Use end-capped column; add 50 mM NaClO₄ to mobile phase; replace column |
| Split peak | Column void (channeling), partially blocked frit, or peptide conformational isomerism | Replace column; elevate column temperature to 40–60°C to promote single conformer |
| Ghost peaks | Late-eluting material from previous injection, column bleed, solvent contamination | Extend wash segment; run blank gradient; replace solvents |
| Rising baseline | Gradient absorbance mismatch between A and B; TFA lot variability | Use same TFA lot for A and B; blank-subtract; ensure ACN is low-UV grade |
Quantifying Purity: Area % vs. Weight %
The industry standard reports purity as area %, because HPLC peak area is proportional to UV absorbance, which varies with the peptide’s extinction coefficient at 214 nm. Two peptides at equal mass concentration may produce different peak areas if their peptide bond counts differ.
Purity (area %) = (Area of main peak ÷ Total integrated area of all peaks) × 100
Limitation: This assumes all peptide-related impurities have similar extinction coefficients at 214 nm. This is approximately true for sequence-related impurities (deletion, truncation sequences) but can underestimate or overestimate non-peptide impurities, residual solvents, and counterions — which is why purity must be supplemented with TFA, water, and AAA data.
3.4 Multi-Component Blend HPLC: The KLOW Challenge
Analyzing a four-component peptide blend (GHK-Cu + BPC-157 + TB-500 + KPV) in a single HPLC run is analytically demanding. The four peptides span a wide polarity range and produce peak separation challenges.
Expected Retention Times (Standard C18 Method)
| Peptide | Approx. tR (min) | MW (Da) | Hydrophobicity | Peak Characteristics |
|---|---|---|---|---|
| KPV | 8–10 | 342.42 | Low (small, polar) | Sharp, early-eluting |
| GHK-Cu | 10–12 | 403.91 | Moderate (Cu complex) | Broad, characteristic blue shoulder |
| BPC-157 | 14–17 | 1419.54 | Moderate-high (acidic peptide) | Asymmetric, moderate tailing |
| TB-500 fragment | 15–20 | Variable (~600–4,963) | Fragment-dependent | Retention highly variable by fragment length |
Method Modifications for Blend Analysis
For simultaneous analysis of the KLOW blend, consider:
- Shallower gradient: 5% B → 60% B over 40 min for improved resolution of the KPV/GHK-Cu pair
- Elevated temperature: 40°C to sharpen GHK-Cu peak and reduce conformational broadening
- Alternative detection: 254 nm for aromatic-containing peptides if present; 604 nm for GHK-Cu copper complex confirmation
Practical recommendation: For blend characterization, individual HPLC traces for each pre-blend peptide provide the most informative purity assessment. Post-blend HPLC confirms that no unexpected degradation or interaction products have formed during co-lyophilization.
4. Mass Spectrometry Identity Confirmation
4.1 ESI-MS Principles and Parameters
Electrospray ionization mass spectrometry (ESI-MS) is the definitive method for confirming peptide molecular weight and, by extension, amino acid sequence correctness. Unlike HPLC — which reports purity but cannot confirm identity — MS directly measures the mass-to-charge ratio (m/z) and yields the peptide’s monoisotopic or average molecular mass.
Instrument Configuration: Q-TOF Platform
The following parameters are specified for a Waters Xevo G2-XS quadrupole time-of-flight (Q-TOF) mass spectrometer. Equivalent instruments: Thermo Scientific Q Exactive (Orbitrap), Bruker maXis II (Q-TOF), SCIEX TripleTOF 6600.
| Parameter | Setting | Rationale |
|---|---|---|
| Ionization mode | ESI positive ion (ESI+) | Peptides protonate readily at acidic pH (N-terminus, Lys, Arg, His) |
| Capillary voltage | 3.0 kV | Optimized for stable Taylor cone with aqueous-organic solvent (typical for peptides) |
| Cone voltage | 30 V | Low enough to avoid in-source fragmentation; high enough for efficient desolvation |
| Source temperature | 120°C | Sufficient for initial droplet desolvation without thermal degradation |
| Desolvation temperature | 350°C | Required for complete solvent evaporation at 600 L/h gas flow |
| Desolvation gas flow | 600 L/h (N₂) | Nitrogen is standard; sufficient for 1.0 mL/min LC flow rate |
| Cone gas flow | 50 L/h (N₂) | Prevents solvent clustering at the cone orifice |
| Scan range | m/z 100–2,000 | Captures singly charged small peptides (KPV, GHK-Cu) and multiply charged large peptides (TB-500) |
| Scan time | 0.5 sec | Balances sensitivity with chromatographic peak sampling rate |
| Calibration | Sodium formate clusters (m/z 90–2,000) | Provides mass accuracy of <5 ppm across the full scan range |
| Lock mass | Leucine enkephalin (m/z 556.2771) | Real-time mass correction via LockSpray (Waters) or equivalent |
Sample Preparation
- Concentration: 1–10 μg/mL in 50:50 water:acetonitrile + 0.1% formic acid
- Formic acid vs. TFA: Formic acid is preferred for LC-MS — TFA causes significant ion suppression (formation of gas-phase TFA-peptide ion pairs that reduce signal). If TFA is unavoidable, use <0.05% or a “TFA fix” (post-column addition of propionic acid or acetic acid in a make-up flow).
- Direct infusion vs. LC-MS: Direct infusion provides higher signal for mass confirmation; LC-MS provides simultaneous retention time and mass information.
4.2 Expected Masses for KLOW Components
Accurate mass confirmation requires calculating the monoisotopic mass (using the most abundant isotope of each element: ¹H, ¹²C, ¹⁴N, ¹⁶O) for each charge state:
| Peptide | Sequence/Formula | Monoisotopic Mass (neutral) | [M+H]⁺ | [M+2H]²⁺ | [M+3H]³⁺ |
|---|---|---|---|---|---|
| GHK-Cu | C₁₄H₂₂N₆O₄Cu (⁶³Cu) | 402.1067 | 403.1140 | — | — |
| GHK-Cu (⁶⁵Cu isotope) | C₁₄H₂₂N₆O₄Cu (⁶⁵Cu) | 404.1062 | 405.1135 | — | — |
| BPC-157 | C₆₂H₉₈N₁₆O₂₂ | 1418.7143 | 1419.7216 | 710.3644 | 473.9120 |
| KPV | C₁₆H₃₀N₄O₄ | 342.2267 | 343.2340 | — | — |
| TB-500 (Tβ4, full length) | C₂₁₂H₃₅₀N₅₆O₇₈S | 4963.4988 | 4964.5061 | 2482.7567 | 1655.5069 |
| TB-500 fragment (varies) | Supplier/sequence-dependent | — | Verify with supplier specification | — | — |
Key quality check: The ⁶³Cu:⁶⁵Cu isotopic ratio for GHK-Cu is approximately 69:31 (natural abundance). A mass spectrum showing both isotopes at the correct ratio confirms copper incorporation. Absence of the ⁶⁵Cu peak — or a distorted ratio — suggests incomplete copper loading or copper dissociation.
4.3 LC-MS/MS for Peptide Sequencing
When ESI-MS alone cannot distinguish between the target peptide and isobaric sequence variants (same elemental composition, different sequence), LC-MS/MS with collision-induced dissociation (CID) provides sequence-level confirmation.
MS/MS Parameters for Peptide Sequencing
| Parameter | Setting |
|---|---|
| Precursor selection | Quadrupole isolation of [M+2H]²⁺ or [M+3H]³⁺ (better fragmentation than singly charged) |
| Collision energy | Ramped 20–45 eV (dependent on precursor m/z and charge state) |
| Collision gas | Argon |
| Fragment ion scan | m/z 50–2000 |
| Data analysis | de novo sequencing (PEAKS, Byonic, pNovo) or database search (Mascot, MaxQuant) |
Characteristic Fragment Ions
- b-ions: N-terminal fragments (amino-to-carbonyl cleavage); used for N-terminal sequence confirmation
- y-ions: C-terminal fragments (carbonyl-to-nitrogen cleavage); used for C-terminal sequence confirmation
- Immonium ions: Single-amino-acid marker ions in the low-mass region (m/z 70–160); confirm presence of specific residues (e.g., His immonium at m/z 110.07)
When to use LC-MS/MS: When the supplier cannot provide an FDA- or EP-compliant impurity profile, when the ESI-MS spectrum shows a mass consistent with both the target peptide and a potential deletion sequence (e.g., des-Gly BPC-157), or when unexpected chromatographic peaks suggest sequence-related impurities.
4.4 High-Resolution Mass Spectrometry (HRMS)
For exact mass measurement with mass accuracy <5 ppm (and often <1 ppm), HRMS instruments (Q-TOF, Orbitrap, FT-ICR) provide elemental composition-level confidence:
| Instrument | Typical Mass Accuracy | Resolving Power | Notes |
|---|---|---|---|
| Q-TOF (Waters Xevo G2-XS) | <5 ppm | 30,000–40,000 FWHM | Good balance of resolution, speed, and cost |
| Orbitrap (Thermo Q Exactive) | <3 ppm | 140,000 FWHM | Highest resolving power for routine use; isotope fine structure resolved |
| FT-ICR (Bruker solariX) | <1 ppm | >1,000,000 FWHM | Research-grade; capable of resolving ¹³C vs. ¹⁵N isotopic fine structure |
For peptide identity confirmation, HRMS at <5 ppm mass accuracy provides unambiguous molecular formula determination for peptides up to ~2,000 Da. For larger peptides, multiply charged ion deconvolution with isotopic distribution fitting provides equivalent confidence.
5. Endotoxin Testing: LAL Assay
5.1 Why Endotoxin Testing Is Non-Negotiable
Bacterial endotoxins (lipopolysaccharides, LPS) are pyrogenic, heat-stable components of Gram-negative bacterial outer membranes. A single E. coli cell contains approximately 2 × 10⁶ LPS molecules. Because synthetic peptides are produced via solid-phase synthesis — not sterile fermentation — endotoxin contamination typically originates from:
- Water used in synthesis, purification, and lyophilization
- Chromatography resins and buffers
- Laboratory glassware and equipment
- Environmental exposure during handling and packaging
The problem for researchers: LPS at femtogram-per-milliliter concentrations activates TLR4/MD-2/CD14 signaling, triggering NF-κB nuclear translocation and secretion of TNF-α, IL-1β, IL-6, and other pro-inflammatory mediators. This activation is indistinguishable from the biological effects being studied in many cell-based assays — creating false positives, altering gene expression baselines, and confounding dose-response relationships.
5.2 Kinetic Chromogenic LAL Method
The kinetic chromogenic Limulus Amebocyte Lysate (LAL) assay is the pharmacopoeial reference method (USP <85>, EP 2.6.14, JP 4.01). It quantifies endotoxin by measuring the rate of color development when LAL reagent (containing a recombinant Factor C or traditional horseshoe crab lysate) is activated by endotoxin in the presence of a chromogenic substrate.
| Parameter | Specification |
|---|---|
| Method | Kinetic chromogenic LAL |
| Lysate | Lonza Kinetic-QCL (or equivalent: Charles River Endosafe, Associates of Cape Cod Pyrochrome) |
| Lysate sensitivity (λ) | 0.005 EU/mL |
| Standard curve range | 0.005–5.0 EU/mL (RSE: USP Reference Standard Endotoxin, E. coli O113:H10) |
| Microplate reader | BioTek ELx808 or Molecular Devices SpectraMax with 37 ± 1°C incubation |
| Detection wavelength | 405 nm (p-nitroaniline release from chromogenic substrate) |
| Reaction time | 60–90 min (onset time inversely proportional to endotoxin concentration) |
| Data analysis | Log-log linear regression of onset time vs. endotoxin concentration; r² ≥0.980 |
5.3 Acceptance Criteria for Research Peptides
| Grade | Endotoxin Limit | Typical Application |
|---|---|---|
| Cell-culture grade | <0.01 EU/μg peptide | Primary cell cultures, immune cell assays, sensitive reporter lines |
| Research grade | <0.1 EU/μg peptide | Standard in vitro experiments, biochemical assays |
| General laboratory grade | <1.0 EU/μg peptide | Analytical method development, non-cell-based work |
| GMP/clinical grade | <0.005 EU/μg peptide | Per pharmacopoeial monograph for injectable products |
5.4 Interference Testing and Positive Product Control (PPC)
Peptides can interfere with the LAL reaction through:
- LAL inhibition: Protease activity, chelating agents (EDTA), or pH extremes that inactivate the clotting enzyme cascade
- LAL enhancement: β-glucan contamination (activates Factor G pathway, producing false positive), or non-specific protease activity
Required testing protocol:
- Test the peptide solution at three dilutions: 1:10, 1:100, and 1:1,000 (in LAL Reagent Water, LRW)
- Spike each dilution with a known endotoxin concentration (typically 0.5 EU/mL, mid-range standard)
- Calculate spike recovery: (measured – unspiked) ÷ known spike × 100
- Acceptance: Spike recovery must fall within 50–200% at the dilution used for reporting
- If interference is detected at all dilutions, the peptide may require buffer exchange, heat treatment (70°C × 10 min, if thermostable), or alternative endotoxin detection methods (recombinant Factor C assay, rFC)
A COA that reports an endotoxin value without PPC spike recovery data does not provide a valid, interpretable result.
6. Residual Impurity Analysis
6.1 TFA Analysis by Ion Chromatography
Trifluoroacetic acid (TFA) is the most common ion-pairing reagent in peptide RP-HPLC purification. It remains as the counterion unless a salt-exchange step (acetate displacement) is performed. Residual TFA is a concern because:
- TFA is biologically active: At millimolar concentrations, TFA inhibits cellular enzymes, alters membrane permeability, and can produce cytotoxic artifacts in cell-based assays at concentrations exceeding ~0.1% (v/v) in the dosing solution.
- TFA adds mass: 1% residual TFA means 10 mg of “peptide” powder contains 0.1 mg of TFA counterion — contributing to the purity-vs-content discrepancy.
Ion Chromatography Method for TFA Quantitation
| Parameter | Specification |
|---|---|
| Instrument | Dionex ICS-6000 or ICS-5000+ with Eluent Generator |
| Column | Dionex IonPac AS11-HC, 4 × 250 mm (or AS15, 4 × 250 mm) |
| Guard column | Dionex IonPac AG11-HC, 4 × 50 mm |
| Eluent | KOH gradient: 1 mM (0–5 min), 1 → 60 mM (5–30 min), 60 mM (30–35 min) |
| Eluent generator | Dionex EGC 500 KOH cartridge |
| Flow rate | 1.0 mL/min |
| Suppressor | Dionex AERS 500, 4 mm, electrolytic mode, 50 mA |
| Detection | Suppressed conductivity |
| Injection volume | 25 μL |
| TFA retention time | ~6.5 ± 0.3 min |
| Calibration range | 0.1–100 μg/mL TFA (R² ≥0.999) |
| LOQ (limit of quantitation) | 0.01% w/w (100 ppm) for a 10 mg/mL sample |
| Acceptance criterion | <1.0% TFA w/w for research-grade peptides |
Note: Some research protocols require <0.1% TFA. This requires a dedicated acetate salt-exchange step during purification and should be specified at the time of ordering.
6.2 Water Content by Karl Fischer Titration
Residual water in lyophilized peptide powder directly reduces net peptide content and accelerates hydrolytic degradation. Karl Fischer (KF) titration is the specific, quantitative method for water determination — it measures water content via the stoichiometric reaction:
I₂ + SO₂ + H₂O + 3RN + CH₃OH → 2RN·HI + RN·HSO₄CH₃
Coulometric KF Method (for ≤1% water)
| Parameter | Specification |
|---|---|
| Instrument | Mettler Toledo C30S Compact Karl Fischer Coulometer (or equivalent: Metrohm 831 KF Coulometer) |
| Reagent | Hydranal-Coulomat AG (or equivalent iodine-based anolyte/catholyte) |
| Sample mass | 10–50 mg (accurately weighed to 0.01 mg) |
| Drift | <10 μg H₂O/min (system stability check before sample addition) |
| Extraction time | 300 sec (or until drift returns to baseline) |
| Acceptance criterion | <5.0% H₂O w/w for lyophilized peptides |
| Calibration verification | Hydranal Water Standard 1.0 (1.0 mg H₂O/g) or water-saturated 1-octanol |
Water content thresholds for concern:
| Water Content | Interpretation |
|---|---|
| <2% | Excellent; well-optimized lyophilization cycle |
| 2–5% | Acceptable for research-grade peptides |
| 5–10% | Elevated; may indicate inadequate secondary drying or moisture ingress; stability may be compromised |
| >10% | Unacceptable; the vial likely leaked or was improperly sealed; degradation products likely present |
6.3 Residual Solvents and Counterions
Beyond TFA and water, peptide powders may contain:
| Impurity | Source | Analytical Method | Typical Limit |
|---|---|---|---|
| Acetonitrile | HPLC purification solvent | GC headspace (USP <467>) | <410 ppm (Class 2 solvent) |
| Dichloromethane (DCM) | SPPS cleavage/washing | GC headspace | <600 ppm |
| Diisopropyl Ether | Peptide precipitation | GC headspace | <5,000 ppm |
| Acetate | Counterion exchange (desired, replaces TFA) | Ion chromatography | Reported, not limited |
| Trifluoroacetate (TFA) | Ion-pairing agent | Ion chromatography (see §6.1) | <1.0% w/w |
| Piperidine | SPPS Fmoc deprotection | GC-MS or LC-MS (derivatized) | <100 ppm |
| Palladium | Catalytic hydrogenation (if used) | ICP-MS | <10 ppm (Class 1 metal) |
| Heavy metals (total) | Reagents, water, equipment | USP <231> or ICP-MS | <20 ppm |
Most research-grade COAs report only TFA and water content. If the peptide will be used in trace-metal-sensitive experiments, request ICP-MS elemental analysis data for the specific metals of concern (Cu, Fe, Zn, Mn, Ni, Pd).
7. Amino Acid Analysis (AAA)
7.1 Why AAA Is the Gold Standard for Peptide Content
HPLC purity reports the fraction of UV-absorbing material that is the target peptide. It does not — and cannot — measure:
- Non-UV-absorbing components (counterions, water, inorganic salts)
- UV-absorbing non-peptide impurities (with the “wrong” extinction coefficient)
- Incomplete peptide chains that co-elute with the parent peptide
Amino acid analysis (AAA) solves this by measuring the absolute quantity of each amino acid in a hydrolyzed peptide sample. Comparison with the theoretical amino acid composition yields the net peptide content as a percentage of gross weight — the single most important number for accurate solution preparation.
7.2 AAA Workflow
- Acid hydrolysis: Peptide (~1 mg) is hydrolyzed in 6N HCl + 1% phenol (antioxidant, protects Tyr) at 110°C for 24 hours under vacuum or inert atmosphere.
- Derivatization: Liberated amino acids are derivatized with:
- AccQ•Tag (Waters): 6-aminoquinolyl-N-hydroxysuccinimidyl carbamate (AQC); fluorescent detection at Ex 250 nm / Em 395 nm; all amino acids including secondary amines (Pro) detected
- OPA/FMOC (Agilent): o-phthalaldehyde for primary amines (Ex 340/Em 450) + fluorenylmethyl chloroformate for secondary amines (Ex 266/Em 305)
- PITC (Edman-type): Phenylisothiocyanate; UV detection at 254 nm
- HPLC separation: C18 column with acetate-phosphate-acetonitrile gradient; 17 amino acid standards (excluding Trp and Cys, which are degraded during acid hydrolysis; require separate analysis)
- Quantitation: External calibration with amino acid standard H (Pierce/Thermo); normalize to internal standard (norleucine or α-aminobutyric acid)
7.3 Calculating Net Peptide Content
Example calculation for BPC-157 (theoretical composition: Asp₂, Glu₂, Ser, Gly₃, Ala, Pro, Val₂, Leu, Lys, Arg, Phe):
- Hydrolyze 1.000 mg of BPC-157 powder
- Quantify each amino acid (nmol/mg powder)
- Divide each by its expected residues per molecule → yields nmol peptide/mg powder
- Average across all stable amino acids (exclude degraded residues: Met, Cys, Trp)
- Multiply by peptide MW → net peptide mass
Result example:
- Average nmol peptide determined: 550 nmol/mg powder
- BPC-157 MW: 1419.54 g/mol
- Net peptide content: 550 × 10⁻⁶ × 1419.54 × 1,000 = 780.7 mg/g = 78.1% w/w
This means 10 mg of lyophilized powder contains 7.8 mg of actual BPC-157 peptide — the remaining 2.2 mg is TFA counterion, water, and minor impurities. All molar concentrations calculated from gross weight will be overestimated by ~28% if not corrected for net peptide content.
Typical net peptide content ranges for research peptides: 70–90% w/w. Values below 65% suggest excessive counterion or moisture and should prompt rejection. Values above 92% are unusual for TFA-salt peptides (acetate salts can reach 90–95%).
8. Peptide Stability Testing
8.1 The ICH Q1A Framework Adapted for Research Peptides
The ICH Q1A(R2) guideline — “Stability Testing of New Drug Substances and Products” — provides the conceptual framework for peptide stability assessment, adapted for research contexts:
| Study Type | Conditions | Duration | Purpose |
|---|---|---|---|
| Forced degradation | Heat (60°C), humidity (75% RH), acid (0.1N HCl), base (0.1N NaOH), oxidation (3% H₂O₂), photolysis (ICH Q1B) | 24 hours – 14 days | Identify degradation pathways, establish stability-indicating nature of analytical method |
| Accelerated stability | 25°C/60% RH and 40°C/75% RH | 1, 3, 6 months | Predict long-term stability; identify degradation kinetics |
| Real-time stability | Recommended storage (−20 ± 5°C, desiccated, protected from light) | 0, 3, 6, 12, 18, 24 months | Establish actual shelf life under intended storage conditions |
| In-use stability | Reconstituted in PBS (pH 7.4, 4°C) | 0, 1, 3, 7, 14 days | Determine post-reconstitution working window |
8.2 Degradation Pathways by Chemical Class
Synthetic peptides degrade via predictable, sequence-dependent pathways:
| Degradation Pathway | Susceptible Residues | Conditions | Detection Method |
|---|---|---|---|
| Deamidation | Asn, Gln (especially Asn-Gly) | Neutral-to-alkaline pH, elevated temperature | HPLC (shift to earlier retention), MS (+1 Da), IEX |
| Oxidation | Met (→ Met sulfoxide), Cys, Trp, His | Exposure to oxygen, light, peroxides | HPLC (shift in retention), MS (+16 Da per Met) |
| Asp isomerization | Asp-Gly, Asp-Ser, Asp-Asp | pH 4–8, elevated temperature | HPLC (isoAsp formation), MS (same mass, but enzymatic digestion patterns differ) |
| Hydrolysis | Asp-Pro (acid-labile), peptide backbone | Extreme pH, high temperature | HPLC (new fragment peaks), MS (truncation masses) |
| Diketopiperazine formation | N-terminal dipeptides (especially Pro at position 2, Gly at position 1) | Neutral pH, in solution | MS (−18 Da, cyclization) |
| Aggregation | Hydrophobic sequences, β-sheet formers | High concentration, specific pH/buffer conditions | SEC-HPLC, DLS, ThT fluorescence |
| Cu²⁺ dissociation | GHK-Cu specifically | Low pH (<4.0), competing chelators | UV-Vis (loss of 604 nm band), HPLC (shift in tR) |
8.3 Stability-Indicating Method Requirements
A stability-indicating HPLC method must be validated for specificity — it must resolve the parent peptide from all major degradation products. Key method parameters to verify:
- Resolution (Rs) ≥1.5 between parent peptide and the nearest degradation product peak
- Peak purity: Diode array detection (DAD) or MS to confirm that no degradation product co-elutes under the parent peak
- Mass balance: Sum of parent + degradation product peak areas should approximate 100% of the initial parent area (allowing for differences in extinction coefficients)
8.4 KLOW Component-Specific Stability Considerations
| Peptide | Primary Degradation Risk | Recommended Monitoring |
|---|---|---|
| GHK-Cu | Cu²⁺ dissociation at pH <4.0, oxidation of His | UV-Vis (604 nm band); HPLC at 214 nm + 254 nm |
| BPC-157 | Asp⁹-Asp¹⁰ isomerization; aggregation at high concentration | HPLC (isoAsp shifts retention); SEC for aggregates |
| TB-500 | Met⁶ oxidation (if present); N-terminal pyroglutamate | HPLC + MS; LC-MS/MS for oxidation site mapping |
| KPV | Chemically stable; minimal degradation | HPLC for appearance of any new peaks; MS confirmation |
For practical storage protocols covering all peptide types, see the peptide stability and preservation guide. For lyophilized powder storage specifically, the peptide powder storage and refrigeration guide provides temperature- and humidity-specific recommendations. Reconstitution protocols that preserve peptide integrity are detailed in the how to reconstitute peptides protocol.
9. Batch Consistency & Supplier Quality Systems
9.1 Why Batch Consistency Matters
A peptide supplier that delivers one excellent batch is common. A supplier that delivers every batch with consistent purity, mass, endotoxin levels, TFA content, water content, and net peptide content is rare — and is the hallmark of a robust quality system.
Batch-to-batch variability manifests in research as:
- Inconsistent dose-response curves between experiments using different batches
- Variable baseline activity in cell-based assays
- Unexplained “good weeks” and “bad weeks” in long-running studies
- Degradation rates that differ between batches of the “same” peptide
The root cause is almost always variations in:
- Lyophilization cycle reproducibility → variable water content and cake structure
- Purification cut-point decisions → variable impurity profiles
- Counterion content → incomplete or variable TFA-to-acetate exchange
- Residual solvent removal → variable drying time/temperature
9.2 Trend Analysis: What to Track Across Batches
For laboratories purchasing research peptides regularly, maintaining a batch tracking spreadsheet is the single most effective quality assurance measure:
| Parameter to Track | Expected CV (Coefficient of Variation) | Action Threshold |
|---|---|---|
| HPLC purity | <1% | Investigate any drop >2% |
| Retention time | <2% | >5% shift = different peptide or column change |
| Water content | <20% CV | Any batch >5% H₂O = reject |
| TFA content | <30% CV | Any batch >1% TFA = request acetate salt |
| Endotoxin | Not normally distributed (Poisson-like) | Any batch >0.1 EU/μg = reject for cell work |
| Appearance | Qualitative — should be consistent | Color change, clumping, or collapsed cake = reject |
9.3 Supplier Audit Domains
When evaluating a peptide supplier — whether a new source or an existing relationship — the following domains should be systematically assessed. For a structured approach, use the peptide supplier audit checklist covering all critical evaluation criteria:
Domain 1: Analytical Capability
- Is HPLC performed in-house or outsourced? In-house enables rapid batch release and method troubleshooting.
- Is MS identity confirmation performed on every batch, or only on selected batches?
- Is LAL testing performed in-house? (Requires dedicated LAL laboratory free of endotoxin contamination.)
- Does the supplier have ion chromatography and Karl Fischer capability, or are these outsourced?
- Are analytical instruments within calibration? Is there a calibration schedule?
Domain 2: Quality Management System
- Is the supplier ISO 9001:2015 certified? ISO 13485 is preferred for peptides with any potential future regulatory trajectory.
- Do batch records exist? Can they be traced from raw material receipt through synthesis, cleavage, purification, lyophilization, and QC release?
- Is there a deviation/CAPA (Corrective and Preventive Action) system? How are out-of-specification (OOS) results handled?
- Are analytical methods validated (accuracy, precision, specificity, LOD/LOQ, linearity, range per ICH Q2(R1))?
Domain 3: Manufacturing Controls
- What scale of SPPS is the supplier equipped for? (Bench scale: 0.1–1 mmol; Pilot scale: 1–50 mmol; Production: >50 mmol)
- What purification capacity? (Preparative HPLC column diameters, flow rates, throughput)
- Is the lyophilizer qualified? (Temperature mapping, vacuum profile, cycle reproducibility)
- Are raw materials (Fmoc-amino acids, resins, solvents) qualified? (Certificate of Conformance, identity testing, supplier qualification)
Domain 4: Documentation
- Are COAs batch-specific and complete (all 7 elements in §2.1)?
- Will the supplier provide raw data (chromatogram files, MS spectra, LAL microplate data) upon request?
- Are stability data available? If not, how does the supplier establish shelf life?
- Is there a product specification sheet beyond the COA?
Domain 5: Business Integrity
- How long has the supplier been in operation?
- Are customer references available? (Names may be confidential, but anonymized testimonials or retention rates are revealing.)
- Can the physical facility be verified? For remote evaluation of manufacturers in regions with limited regulatory transparency, use the verify Chinese peptide manufacturer framework covering documentation verification, video walkthrough protocols, and red-flag checklists.
10. Third-Party Testing vs. Manufacturer COA
10.1 The Case for Independent Verification
A manufacturer’s COA represents a self-declaration. While reputable suppliers generate COA data honestly, the structural incentive to present favorable results exists in any commercial relationship. Independent third-party testing eliminates this conflict of interest.
When third-party testing is warranted:
| Scenario | Recommended Action |
|---|---|
| COA is incomplete (missing endotoxin, TFA, water, or AAA) | Commission the missing test(s) |
| Supplier is new, unestablished, or has limited online presence | Commission full panel |
| Batch-to-batch experimental variability is observed | Test retained samples from each batch |
| Peptide will be used in a publication | Commission pre-experiment verification |
| Work feeds into a grant proposal or regulatory submission | Third-party testing is essentially mandatory |
| Cost of failed experiments exceeds testing cost | Routine third-party spot-checking is cost-effective |
10.2 What Tests to Commission
A tiered approach to third-party testing:
| Tier | Tests | Approximate Cost (USD, 2026) | When to Use |
|---|---|---|---|
| Tier 1: Identity + Purity | HPLC purity + ESI-MS | $150–300 | Initial supplier screening |
| Tier 2: Full Characterization | HPLC + MS + LAL + TFA + KF + AAA | $400–700 | Ongoing supplier quality monitoring |
| Tier 3: Deep Characterization | Tier 2 + LC-MS/MS sequencing + residual solvents (GC) + heavy metals (ICP-MS) + stability study | $1,000–2,500 | Publication support, regulatory enabling work |
| Tier 4: Investigative | Tier 3 + 2D-NMR structure confirmation + peptide content by AAA in triplicate + independent endotoxin by two methods | $3,000–8,000 | When unexpected experimental results demand root-cause investigation |
10.3 Selecting a Third-Party Laboratory
Criteria for selecting an analytical laboratory:
- ISO/IEC 17025 accreditation with peptide analysis in scope (essential)
- Experience with the specific peptide class (small peptides vs. large peptides vs. cyclic vs. modified)
- LAL testing capability with demonstrated low-endotoxin handling (separate facility or dedicated LAL suite)
- Turnaround time (typically 5–15 business days for a full panel)
- Sample quantity required (typically 10–50 mg for a full panel)
- Data delivery format (raw data files + interpreted report; PDF summary alone is insufficient)
10.4 Cost-Benefit Analysis
A single failed cell-culture experiment can waste $500–5,000 in reagents, consumables, personnel time, and opportunity cost — not including the cost of repeating the experiment and the delay to publication. Third-party peptide testing at $400–700 per comprehensive panel is cost-effective when peptide quality is critical to experimental outcomes. Many institutional core facilities offer peptide analysis services at reduced rates for internal users.
11. Frequently Asked Questions
Q1: What is the minimum purity standard for research peptides?
Reputable suppliers synthesize to ≥98% purity by RP-HPLC (C18, 214 nm) for research-grade peptides. For cell-culture-grade peptides or multi-component blends such as the KLOW formulation (GHK-Cu + BPC-157 + TB-500 + KPV), each individual peptide should meet ≥99% purity before blending. Purity below 95% should prompt immediate rejection of the batch — it indicates incomplete purification or degradation. Researchers should always request the actual HPLC chromatogram with integration data, not accept a numeric purity claim without supporting evidence. Importantly, HPLC purity measures peptide chain integrity — not net peptide content, which accounts for counterions and water and is typically 70–90% of gross weight. For the KLOW80 research blend, product-specific technical specifications include individual peptide purity data.
Q2: What should a valid Certificate of Analysis (COA) include?
A complete, defensible COA for a research peptide must include seven core elements: (1) an HPLC chromatogram with peak integration showing ≥98% main peak; (2) an ESI-MS spectrum confirming molecular weight within ±1.0 Da of the theoretical monoisotopic mass; (3) LAL endotoxin result, ideally <0.1 EU/μg for research-grade peptides; (4) residual TFA content by ion chromatography (<1.0% w/w); (5) water content by Karl Fischer titration (<5%); (6) net peptide content by amino acid analysis or elemental nitrogen analysis (typically 70–90% w/w); and (7) appearance description and batch metadata (lot number, date of analysis, analyst). A COA missing any of the first five elements is incomplete and insufficient for due diligence. Product pages such as BPC-157 peptide and GHK-Cu provide examples of the analytical data packages that should accompany research peptides.
Q3: How is peptide purity measured by HPLC, and what are the limitations?
Reversed-phase HPLC on a C18 column (250 × 4.6 mm, 5 μm) with a water-acetonitrile + 0.1% TFA gradient (5–95% B over 30 min) and UV detection at 214 nm is the universal method. Purity is calculated as the area of the target peptide peak divided by the total area of all integrated peaks, expressed as a percentage. The key limitation is that area % purity assumes all components have similar extinction coefficients at 214 nm — sequence-related impurities are approximately accurate but non-peptide impurities, counterions, and water are invisible to this method. Co-elution of impurities under the main peak inflates purity. For critical applications, HPLC purity should be supplemented with LC-MS (to detect co-eluting impurities with different masses) and AAA (for true peptide content). Researchers new to peptide sourcing may benefit from the what is a research peptide overview, which explains the distinction between HPLC purity and actual peptide content.
Q4: What is the difference between peptide purity and net peptide content?
This is the most commonly misunderstood concept in peptide quality. HPLC purity (area %) measures the fraction of UV-absorbing material that is the intact target peptide. Net peptide content (% w/w, determined by AAA) measures the actual mass of peptide per unit gross weight of lyophilized powder. Because synthetic peptides are isolated as salts (TFA or acetate) and contain residual water, the two numbers invariably differ: a peptide that is >99% pure by HPLC may have only 72–88% net peptide content. A 10 mg vial of such a peptide contains 7.2–8.8 mg of actual peptide — the rest is counterion and water. Researchers who calculate molar concentrations from gross weight (without correcting for net peptide content) systematically overestimate peptide concentration by 12–28%. This is not a quality defect — it is a universal property of lyophilized synthetic peptides from any supplier, worldwide. Only amino acid analysis or quantitative elemental nitrogen analysis can determine the true peptide content.
Q5: Why is endotoxin testing essential for research peptides?
Bacterial endotoxins (lipopolysaccharides, LPS) are heat-stable, ubiquitous contaminants that activate innate immune signaling through TLR4/MD-2/CD14. Even femtogram-per-milliliter concentrations trigger NF-κB nuclear translocation, pro-inflammatory cytokine secretion (TNF-α, IL-1β, IL-6), and global changes in gene expression — effects that are indistinguishable from the biological phenomena being investigated in many cell-based assays. Peptides synthesized via SPPS can become contaminated at any stage: water, solvents, resins, chromatography buffers, glassware, and environmental exposure. For any experiment using primary cells, immune-competent cell lines, or functional readouts sensitive to inflammatory signaling, endotoxin-certified peptides (<0.1 EU/μg, tested by kinetic chromogenic LAL with PPC spike recovery 50–200%) are non-negotiable. The peptide quality control page details how endotoxin testing is integrated into comprehensive QC workflows.
Q6: What stability data should researchers expect for research peptides?
At minimum, a supplier should provide: (1) real-time stability data at recommended storage (−20°C, desiccated) at 0, 6, 12, and 24 months showing HPLC purity retention ≥95%; (2) accelerated stability data (25°C/60% RH, 40°C/75% RH) at 1, 3, and 6 months; and (3) a description of the lyophilization cycle parameters (freezing temperature, primary drying temperature/pressure/duration, secondary drying parameters). The HPLC method used for stability testing must be demonstrated as stability-indicating — it must resolve the parent peptide from all major degradation products (Rs ≥1.5). Forced degradation data (heat, acid, base, oxidation, photolysis) identifying the primary degradation pathways and products provide additional confidence. If the supplier cannot provide any stability data, the assigned shelf life is arbitrary. Comprehensive guidance on storage conditions is available in the peptide powder storage and refrigeration guide.
Q7: When should researchers commission independent third-party testing?
Third-party testing by an ISO/IEC 17025-accredited laboratory should be commissioned when: (1) the supplier’s COA is missing critical tests (endotoxin, TFA, water content, AAA); (2) experimental results show unexpected batch-to-batch variability suggesting inconsistent quality; (3) the peptide will support a publication, grant proposal, or regulatory submission where data integrity must be independently verifiable; (4) the supplier is new, lacks an established track record, or operates from a jurisdiction with limited regulatory oversight; or (5) institutional or journal policies require independent analytical verification. A comprehensive panel (HPLC + MS + LAL + TFA + KF + AAA) costs approximately US $400–700 and provides documentation that strengthens experimental conclusions. The decision framework is cost-benefit: when the cost of a failed experiment exceeds the cost of third-party testing, spot-checking is the rational choice.
Q8: What should researchers look for when auditing a peptide supplier?
A systematic supplier evaluation should cover five domains: analytical capability (in-house HPLC, LC-MS, and LAL capabilities vs. outsourced), quality management system (ISO 9001 or ISO 13485 certification, batch record traceability, deviation/CAPA handling), manufacturing controls (SPPS scale, purification capacity, lyophilization cycle validation), documentation practices (batch-specific COAs that include all seven core elements, availability of raw data, stability data), and business integrity indicators (years in operation, customer references, physical facility verifiability). Remote audits for overseas manufacturers are feasible using structured documentation review and video walkthrough protocols — see the verify Chinese peptide manufacturer guide for a detailed framework. For a formal evaluation template covering all critical criteria, the peptide supplier audit checklist provides a systematic evaluation tool. Researchers procuring peptides for rigorous in vitro work should consider custom synthesis programs with defined quality standards, as discussed in the custom peptide synthesis and OEM manufacturing guide.
12. Entity Glossary
| Entity | CAS Number | PubChem CID | UniProt | Description | |
|---|---|---|---|---|---|
| Trifluoroacetic acid (TFA) | 76-05-1 | 6422 | — | Ion-pairing agent in RP-HPLC; counterion in peptide salts | |
| Acetonitrile (ACN) | 75-05-8 | 6342 | — | Organic modifier in RP-HPLC mobile phase; Class 2 residual solvent | |
| Karl Fischer reagent | 7553-56-2 | — | — | Iodine-based reagent for coulometric water determination | · |
| Limulus Amebocyte Lysate (LAL) | — | — | — | Horseshoe crab blood extract; Factor C-mediated endotoxin detection | |
| Lipopolysaccharide (LPS) | — | — | — | Gram-negative bacterial endotoxin; TLR4 agonist | / |
| Phenylisothiocyanate (PITC) | 103-72-0 | 7673 | — | Edman-type derivatization reagent for amino acid analysis | |
| 6-Aminoquinolyl-N-hydroxysuccinimidyl carbamate (AQC) | 148757-94-2 | — | — | Waters AccQ•Tag fluorescent derivatization reagent for AAA | AQC |
| Sodium formate | 141-53-7 | 2723810 | — | ESI-MS calibration standard; forms cluster ions m/z 90–2000 | |
| Leucine enkephalin | 58822-25-6 | 4617765 | — | Lock mass reference compound for accurate mass LC-MS (m/z 556.2771) | |
| Mannitol | 69-65-8 | 6251 | — | Lyophilization cryoprotectant; provides crystalline cake structure | |
| Trehalose | 99-20-7 | 7427 | — | Lyophilization cryoprotectant; amorphous glass protects peptide conformation | |
| Norleucine | 327-57-1 | 9475 | — | Non-proteinogenic amino acid; internal standard for AAA | |
| Hydranal-Coulomat AG | — | — | — | Commercial Karl Fischer anolyte reagent (Honeywell/Fluka) | |
| USP Reference Standard Endotoxin (RSE) | — | — | — | E. coli O113:H10 lipopolysaccharide; primary endotoxin calibrator | USP |
| Factor C (recombinant) | — | — | D3KXG4 | Recombinant horseshoe crab Factor C; synthetic alternative to LAL (rFC assay) | C |
| GHK-Cu | 89030-95-5 | 71587321 | — | Copper tripeptide; square-planar Cu(II) complex; KLOW component K | / |
| BPC-157 | 137525-51-0 | 9941957 | — | Gastric pentadecapeptide; KLOW component L | BPC-157 |
| KPV | 64883-54-9 | 123870 | — | α-MSH(11–13) tripeptide; KLOW component W | KPV |
| TB-500 | — | — | — | Thymosin beta-4 fragment; KLOW component O; fragment identity manufacturer-dependent | TB-500 |
| C18 (Octadecylsilane) | — | — | — | Bonded silica stationary phase for RP-HPLC peptide separations | C18 |
13. References
- Snyder LR, Kirkland JJ, Dolan JW. Introduction to Modern Liquid Chromatography. 3rd ed. Hoboken: John Wiley & Sons; 2010. ISBN: 978-0470167540. [Comprehensive reference for HPLC theory, method development, and troubleshooting.]
- Mánt CT, Hodges RS, eds. High-Performance Liquid Chromatography of Peptides and Proteins: Separation, Analysis, and Conformation. Boca Raton: CRC Press; 1991. ISBN: 978-0849365492. [Classic reference for peptide HPLC; covers column selection, mobile phase optimization, and ion-pairing mechanism.]
- Banerjee S, Mazumdar S. “Electrospray ionization mass spectrometry: a technique to access the information beyond the molecular weight of the analyte.” International Journal of Analytical Chemistry. 2012;2012:282574. PMID: 23213342. [ESI mechanism, charge state distribution, and peptide applications.]
- ICH Harmonised Tripartite Guideline. “Validation of Analytical Procedures: Text and Methodology Q2(R1).” International Conference on Harmonisation. 2005. [Defines accuracy, precision, specificity, detection limit, quantitation limit, linearity, and range for analytical method validation.]
- ICH Harmonised Tripartite Guideline. “Stability Testing of New Drug Substances and Products Q1A(R2).” International Conference on Harmonisation. 2003. [Framework for forced degradation, accelerated stability, and real-time stability studies.]
- United States Pharmacopeia. “<85> Bacterial Endotoxins Test.” USP-NF. Rockville, MD: United States Pharmacopeial Convention; current edition. [Pharmacopoeial standard for LAL assay methodology, acceptance criteria, and interference testing.]
- United States Pharmacopeia. “<921> Water Determination.” USP-NF. Rockville, MD: United States Pharmacopeial Convention; current edition. [Karl Fischer titration method validation and acceptance criteria.]
- European Pharmacopoeia. “2.2.56 Amino Acid Analysis.” Ph. Eur. 11th ed. Strasbourg: European Directorate for the Quality of Medicines & HealthCare (EDQM); 2023. [Hydrolysis, derivatization, and quantification specifications for peptide AAA.]
- ISO/IEC 17025:2017. “General Requirements for the Competence of Testing and Calibration Laboratories.” Geneva: International Organization for Standardization; 2017. [International standard for laboratory quality management and technical competence.]
- Fekete S, Veuthey JL, Guillarme D. “Modern column technologies for the analytical characterization of therapeutic peptides and proteins.” Journal of Pharmaceutical and Biomedical Analysis. 2012;69:9–28. PMID: 22575594. [Core-shell particles, sub-2 μm UHPLC, and column selection for peptide analysis.]
- Chen G, Pramanik BN. “LC-MS for peptide and protein characterization: recent advances and perspectives.” Expert Review of Proteomics. 2009;6(1):89–101. PMID: 19210151. [LC-MS/MS workflows for peptide sequencing and impurity identification.]
- McCullough KZ, Hainmayer LC. “The role of the positive product control in the LAL test.” LAL Update. 2006;23(3):1–6. [PPC spike recovery interpretation and interference troubleshooting in LAL assays.]
- Cooper JF, Levin J, Wagner HN. “Quantitative comparison of in vitro and in vivo methods for the detection of endotoxin.” Journal of Laboratory and Clinical Medicine. 1971;78(1):138–148. PMID: 4934703. [Foundation paper establishing quantitative LAL methodology.]
- Pickart L, Margolina A. “Regenerative and protective actions of the GHK-Cu peptide in the light of the new gene data.” International Journal of Molecular Sciences. 2018;19(7):1987. PMID: 29986501. [GHK-Cu gene expression data; relevant to stability testing and analytical characterization of the largest KLOW component.]
- Sikirić P, Seiwerth S, Rucman R, et al. “Stable gastric pentadecapeptide BPC 157: review of novel pleiotropic effects.” Current Pharmaceutical Design. 2014;20(7):1124–1134. PMID: 23755734. [BPC-157 pharmacology and structural stability; relevant to COA purity specifications for this peptide.]
- Briscoe CJ, Hage DS. “Factors affecting the stability of drugs and drug metabolites in biological matrices.” Bioanalysis. 2009;1(1):205–220. PMID: 21083195. [General principles of chemical stability applicable to peptide degradation pathway analysis.]
14. Further Reading on RPL Peptides
For researchers seeking detailed guidance on peptide sourcing, quality assessment, and laboratory handling:
- Peptide Quality Control: Central Resource — Comprehensive overview of HPLC purity analysis, LC-MS identity confirmation, amino acid analysis, impurity profiling, stability testing, endotoxin testing, and the distinction between GMP and research-grade production. The definitive RPL Peptides QC page covering every analytical method discussed in this guide.
- Peptide Supplier Audit Checklist — A structured evaluation framework with scored domains covering analytical capability, quality management systems, manufacturing controls, documentation practices, and business integrity indicators. Use this checklist for systematic supplier due diligence.
- How to Verify a Chinese Peptide Manufacturer — Remote audit protocol for evaluating peptide manufacturers including documentation requirements, video walkthrough verification, red-flag indicators, and communication templates. Essential for researchers sourcing from international suppliers.
- Custom Peptide Synthesis & OEM Manufacturing Quality Standards — Quality benchmarks for solid-phase peptide synthesis (SPPS), bulk purification, lyophilization, and analytical release testing in custom and OEM manufacturing contexts. Relevant for laboratories procuring peptides at scale.
- Peptide Stability & Preservation Guide — Best practices for lyophilized storage, reconstitution, and solution-phase stability across peptide classes. Includes temperature and humidity specifications, freeze-thaw guidance, and peptide-specific degradation pathway data.
15. Related Research Guides
Quality standards are the foundation for reproducible peptide research. These companion guides provide detailed analysis of individual peptides within the KLOW research blend:
- GHK-Cu Deep-Dive — The copper tripeptide: square-planar coordination chemistry, 4,000-gene expression signature, LOX-mediated ECM cross-linking, and ferroxidase activity. See also: GHK-Cu product page.
- BPC-157 Deep-Dive — The gastric pentadecapeptide: angiogenic signaling, nitric oxide modulation, endothelial barrier function, and the BPC-157 replication landscape. See also: BPC-157 product page.
- TB-500 Deep-Dive — The thymosin beta-4 fragment: actin sequestration kinetics, cell migration mechanisms, and fragment-specific analytical considerations. See also: TB-500 product page.
- KPV Deep-Dive — The α-MSH-derived tripeptide: MC1R-mediated signaling, NF-κB pathway modulation, and receptor pharmacology. See also: KPV product page.
- Peptide Synergy Analysis — The KLOW blend synergy rationale: pathway integration models, temporal sequence hypotheses, and experimental frameworks for combinatorial peptide research.
- KLOW80 Research Peptide — The complete four-peptide blend product page with individual component specifications, analytical data, and research-use information.
Disclaimer: This article is intended exclusively for informational and research-context purposes. It does not constitute medical advice, product endorsement, or usage recommendation. The analytical methods, acceptance criteria, and supplier evaluation frameworks described herein are provided as laboratory reference information and should be adapted to institutional requirements, regulatory context, and the specific peptide under investigation. Research peptides — including GHK-Cu, BPC-157, TB-500, KPV, and the KLOW blend — are research chemicals that have not been evaluated by the FDA or any equivalent regulatory authority for safety or efficacy. They are not approved as drugs, biologics, dietary supplements, or cosmetic ingredients. All statements regarding peptide stability, degradation pathways, and analytical method performance are based on published peer-reviewed literature and general principles of analytical chemistry, and should be verified under the specific laboratory conditions in which the peptides will be used. Researchers are responsible for complying with all applicable institutional, local, and national regulations governing the acquisition, storage, use, and disposal of research chemicals.