KLOW Peptide Blend Synergy Analysis
Pathway Integration, Temporal Dynamics & Combinatorial Research Models — August 2026
Parent page: This cluster is part of the KLOW Peptide Blend: Complete Scientific Guide. It covers the hypothesized synergy mechanisms, pathway integration models, experimental design frameworks, and comparative analyses relevant to the four-peptide combination. For individual peptide deep-dives, see Clusters 1–4.
TL;DR — Key Takeaways
- Synergy in the KLOW blend is entirely hypothetical. Zero peer-reviewed publications exist on the complete four-peptide combination as of 2026. Every synergy claim herein is derived from individual peptide mechanisms and pathway-level biochemical reasoning.
- The blend is hypothesized to operate through four distinct signaling axes: ECM remodeling (GHK-Cu), NO/VEGF signaling (BPC-157), actin cytoskeletal dynamics (TB-500), and receptor-mediated signaling context (KPV). These axes converge at Akt, which functions as a dual-input central signaling hub with OR-gate architecture.
- A NO + Copper positive-feedback loop is hypothesized between BPC-157 (NO upregulation) and GHK-Cu (Cu²⁺ delivery), mediated by copper-dependent eNOS dimerization and NO-mediated S-nitrosylation of copper chaperone proteins. This loop has not been experimentally validated under co-exposure conditions.
- KPV’s role is characterized as “signaling context modulation” — its MC1R-mediated NF-κB suppression may relieve Smad2/3 antagonism at collagen gene promoters, creating a permissive biochemical environment for GHK-Cu’s ECM-remodeling program.
- The Chou-Talalay Combination Index (CI) provides a rigorous quantitative framework for synergy testing: CI < 1 = synergy, CI = 1 = additivity, CI > 1 = antagonism. No CI data exist for any KLOW peptide pair, triplet, or full blend.
- Comparative pathway coverage across configurations: KLOW (4 axes) > BPC+TB (2 axes) > GHK alone (1 axis). However, broader coverage correlates with increased complexity, characterization burden, and unvalidated interaction risk.
Table of Contents
- 3.1 Akt as Central Signaling Hub
- 3.2 NO + Copper Reciprocal Enhancement
- 3.3 KPV Signaling Context Modulation
- 3.4 MMP/TIMP + Actin Convergence
- Temporal Sequence Model
- Comparative Synergy Analysis
- Experimental Design for Synergy Testing
- Open Questions & Limitations
- Research Applications
- Frequently Asked Questions
- Entity Glossary
- References
- Further Reading on RPL Peptides
- Related Research Guides
1. Defining Synergy in Peptide Research
1.1 The Concept of Synergy
Synergy, in pharmacological and biochemical terms, describes a situation where the combined effect of two or more agents exceeds what would be expected from the sum of their individual effects. The biologically meaningful question is not merely “do these peptides work together?” but rather “does the observed combined effect exceed what additivity would predict?”
For the KLOW blend — a defined mixture of four separately synthesized peptides co-lyophilized into a single vial — the synergy question is central to its conceptual rationale. Each of the four component peptides (GHK-Cu, BPC-157, TB-500, KPV) has a body of individual literature supporting distinct biochemical activities. The blend’s premise is that these activities are not merely additive but mutually reinforcing — that the combination creates a pathway-level effect greater than the sum of its parts.
1.2 The Chou-Talalay Combination Index (CI) Methodology
The gold-standard quantitative framework for synergy analysis is the median-effect equation and combination index (CI) method developed by Ting-Chao Chou and Paul Talalay (Chou & Talalay, 1984; Chou, 2006). This method is based on the mass-action law and does not require knowledge of mechanism of action — making it applicable to peptide combinations whose molecular targets may be partially or entirely unknown.
The core equation is the median-effect equation:
fa / fu = (D / Dm)^m
Where:
- fa = fraction affected (0 to 1)
- fu = fraction unaffected (1 − fa)
- D = concentration
- Dm = median-effect concentration (analogous to EC50 or IC50)
- m = Hill coefficient (slope; m > 1 = positive cooperativity, m = 1 = hyperbolic, m < 1 = negative cooperativity)
Taking the logarithm: log(fa/fu) = m log(D) − m log(Dm)
This linearizes the concentration-response relationship, enabling Dm and m to be determined from linear regression of the median-effect plot for each individual agent.
The Combination Index (CI) for a given effect level (fa) is then calculated as:
CI = (D)₁/(Dx)₁ + (D)₂/(Dx)₂ + (D)₁(D)₂/α(Dx)₁(Dx)₂
Where:
- (Dx)₁, (Dx)₂ = concentrations of agents 1 and 2 alone required to produce x% effect
- (D)₁, (D)₂ = concentrations of agents 1 and 2 in combination that produce the same x% effect
- α = interaction parameter: α = 0 for mutually exclusive drugs (same target/same mode), α = 1 for mutually nonexclusive drugs (different targets/different modes)
For the KLOW blend, the appropriate model parameter is α = 1 (mutually nonexclusive), since GHK-Cu, BPC-157, TB-500, and KPV operate through distinct primary mechanisms (copper delivery, NO upregulation, actin sequestration, and GPCR activation, respectively). However, the convergence of these mechanisms at shared downstream nodes (particularly Akt) creates a more complex situation where mechanistic exclusivity is partial, not absolute.
Interpretation:
| CI Value | Classification | Interpretation |
|---|---|---|
| CI < 0.1 | Very strong synergism | — |
| CI 0.1–0.3 | Strong synergism | — |
| CI 0.3–0.7 | Synergism | Combined effect exceeds additive prediction |
| CI 0.7–0.85 | Moderate synergism | — |
| CI 0.85–0.90 | Slight synergism | — |
| CI 0.90–1.10 | Nearly additive | Combined effect approximates sum of parts |
| CI 1.10–1.20 | Slight antagonism | — |
| CI 1.20–1.45 | Moderate antagonism | Combined effect less than additive prediction |
| CI > 1.45** | Antagonism | Combined effect falls below what either agent could achieve alone |
1.3 Additivity Models: Loewe vs. Bliss
Beyond Chou-Talalay, two additional additivity frameworks are relevant for peptide combination analysis:
Loewe Additivity (Isobologram Method): Assumes agents act through the same mechanism (mutually exclusive). The additivity condition is: (D)₁/(Dx)₁ + (D)₂/(Dx)₂ = 1. For n agents, the sum ≤ 1 represents additivity or synergy; sum > 1 indicates antagonism. The isobologram — a plot of (D)₁ vs. (D)₂ at a constant effect level — provides a visual representation: points below the line of additivity indicate synergy, points above indicate antagonism.
Bliss Independence: Assumes agents act through independent mechanisms. The predicted combined effect is: E₁₂ = E₁ + E₂ − E₁·E₂ (where E is fraction affected). An observed effect greater than this prediction suggests synergy. Bliss independence is particularly appropriate when the peptides’ primary mechanisms are mechanistically distinct — as is the case for the KLOW components.
For the KLOW blend, Loewe additivity is applicable at shared downstream nodes (e.g., Akt phosphorylation, where GHK-Cu and BPC-157 converge), while Bliss independence is applicable at the pathway level (e.g., ECM remodeling vs. actin dynamics). A comprehensive synergy analysis would employ both frameworks.
1.4 Why Synergy Testing Matters for Multi-Peptide Blends
Multi-peptide research blends raise a fundamental question that is both scientific and practical: does the combination justify its complexity? A four-peptide blend requires:
- Four separate SPPS syntheses with individual purification and characterization
- Post-blend analytical verification (RP-HPLC resolution of four distinct peaks)
- Heteromeric interaction risk (Cu²⁺ redistribution between GHK and other peptide amines)
- Stability monitoring across four distinct degradation pathways
If the combined effect is merely additive — each peptide contributing independently without enhancement — then separate administration of individual peptides would be scientifically equivalent and analytically simpler. Synergy is therefore not an academic question but a threshold justification for the blend format itself. This is why rigorous CI analysis, though technically demanding, is essential for validating the KLOW blend rationale.
Critical caveat: As of 2026, zero Chou-Talalay combination index data exist for the KLOW four-peptide blend. No concentration-response curves for any peptide pair, triplet, or the complete blend have been published. The entire synergy discussion that follows is a mechanistic hypothesis framework — not an empirical finding.
2. The Four-Axis Pathway Architecture
2.1 Pathway Map Overview
The KLOW blend targets four distinct but interconnected signaling axes, each with a primary peptide driver and quantifiable downstream readouts. The following table — expanded from the pillar document (§4.1) — integrates quantitative data from the individual peptide deep-dives (Clusters 1–4):
| Axis | Primary Peptide(s) | Key Effector(s) | Quantitation | Assay Method | Reference Context |
|---|---|---|---|---|---|
| ECM Remodeling | GHK-Cu | LOX activity, COL1A1 expression, TIMP/MMP ratio | LOX activity ↑1.5 ± 0.2× at 48h; COL1A1 mRNA ↑3.2× at 24h; TIMP/MMP ratio 2.2:1 | Amplex Red fluorometric, qRT-PCR, Luminex multiplex ELISA | Pickart et al., 2015; Pickart & Margolina, 2018; Kang et al., 2020 |
| NO/VEGF Signaling | BPC-157 | eNOS-pS1177, NO production, VEGFR2-pY1175, cGMP | eNOS ↑2.4×; NO (nitrite) 3.8 vs. 1.2 μM; p-VEGFR2 ↑4.2× at 30 min; cGMP ↑2.6× | Western blot, Griess assay, phospho-specific WB, cGMP ELISA | Hsieh et al., 2017; Seiwerth et al., 2018; Sikirić et al., 2014 |
| Actin Dynamics | TB-500 | G/F-actin ratio, cell migration speed | G-actin pool ↑1.7× at 2h; gap closure 72 ± 8% vs. 41 ± 6% control at 24h | DNase I inhibition, scratch-wound assay, phalloidin/DNase I co-staining | Philp et al., 2003; Kim et al., 2024; Mogilner & Edelstein-Keshet, 2023 |
| Signaling Context | KPV | NF-κB nuclear translocation, IκBα half-life, cAMP | p65 translocation ↓ to 22 ± 6% cells; IκBα t₁/₂ extended 18→41 min; cAMP elevation at 10 μM | NF-κB luciferase reporter, IF, Western blot, cAMP ELISA | Getting et al., 2003; Brzoska et al., 2008 |
2.2 Convergence Architecture
The four axes do not operate in isolation — they converge at multiple shared signaling nodes. The most prominent convergence points are:
- Akt (Ser473): Receives dual inputs from GHK-Cu (integrin-FAK-Akt) and BPC-157/TB-500 (VEGFR2-PI3K-Akt). This is the central integration hub (detailed in §3.1).
- eNOS (Ser1177): Directly activated by Akt phosphorylation (from both GHK-Cu and BPC-157 signals) and structurally dependent on copper (from GHK-Cu) for dimerization. This is the node at which the NO+Cu loop operates (§3.2).
- COL1A1/COL3A1 Promoters: Receive positive input from GHK-Cu’s TGF-β/Smad2/3 pathway and negative input from NF-κB (p65), which KPV suppresses. This is the node at which KPV’s signaling context modulation operates (§3.3).
- Focal Adhesion Complexes: Respond to both ECM composition (GHK-Cu → LOX cross-linked matrix) and actin dynamics (TB-500 → G-actin pool expansion). This is the MMP/TIMP + actin convergence node (§3.4).
2.3 Quantitatively Characterized vs. Hypothesized Interactions
It is essential to distinguish between interactions that have direct quantitative support from individual peptide studies and those that are purely theoretical pathway extrapolations:
| Interaction Type | Example | Evidence Level |
|---|---|---|
| Established individual mechanism | GHK-Cu → LOX activation (Amplex Red, 1.5±0.2× at 48h) | Quantitative, replicated, ≥3 independent groups |
| Established individual mechanism | BPC-157 → eNOS ↑2.4× (Western blot, HUVEC) | Quantitative, partially replicated (Taiwan group) |
| Pathway convergence (biochemically plausible) | GHK-Cu (FAK→Akt) + BPC-157 (VEGFR2→Akt) → enhanced p-Akt | Hypothesized; no co-exposure data |
| Positive feedback loop (mechanistically coherent) | GHK-Cu (Cu²⁺) + BPC-157 (NO) → reciprocal enhancement | Hypothesized; no co-exposure data |
| Signaling context modulation (indirect evidence) | KPV (NF-κB↓) may relieve Smad2/3 antagonism at COL1A1 | Supported by IL-1β attenuation data; no direct KPV+GHK-Cu co-exposure |
| Temporal sequence (kinetically plausible) | KPV Phase 1 → TB-500/BPC-157 Phase 2 → GHK-Cu Phase 3–4 | Theoretical; no time-course co-exposure data |
3. Synergy Nodes — Deep Analysis
3.1 Akt as Central Signaling Hub
3.1.1 Dual-Input Architecture
The convergence of two mechanistically distinct upstream pathways on Akt phosphorylation (Ser473 and Thr308) creates what signal transduction theory describes as a dual-input, single-output node with analog summation. This architecture is functionally significant because it allows the cell to integrate ECM-derived and vascular-derived signals into a unified readout (p-Akt level), which in turn controls multiple downstream effector pathways.
Input 1 — ECM-Integrin Axis (GHK-Cu):
GHK-Cu → ECM remodeling (LOX cross-linking, TIMP/MMP balance) → integrin clustering (αvβ3, α5β1) → FAK autophosphorylation (Y397) → PI3K recruitment (p85 subunit) → PIP3 generation → PDK1 → Akt(Thr308) phosphorylation → partial Akt activation
Input 2 — Vascular-VEGFR2 Axis (BPC-157 / TB-500):
BPC-157 → VEGFR2 upregulation and phosphorylation (Y1175) → PI3K recruitment (via p85-VEGFR2 interaction) → PIP3 → PDK1 → Akt(Thr308) → mTORC2 → Akt(Ser473) → full Akt activation
The key distinction is that the ECM axis delivers a sustained, moderate-amplitude signal (integrin engagement is tonic in adherent cells), while the vascular axis delivers a phasic, high-amplitude signal (growth factor receptor signaling peaks rapidly and desensitizes). The combination may produce both higher peak p-Akt levels (amplitude synergy) and prolonged p-Akt duration (temporal synergy).
3.1.2 Quantitative Predictions
Using the individual peptide data:
- GHK-Cu alone: p-FAK(Y397) ↑2.1 ± 0.3× at 30 min (phospho-ELISA). Assuming this translates to ~2× Akt activation, the effect size for GHK-Cu on p-Akt alone is predicted at approximately 1.5–2.5× over baseline.
- BPC-157 alone: p-VEGFR2(Y1175) ↑4.2 ± 0.8× at 30 min. This dramatic receptor-level effect likely produces ~3–5× Akt activation in VEGFR2-expressing cells (endothelial, some fibroblast populations).
- Co-exposure prediction (Loewe additivity): The predicted combined p-Akt level under Loewe additivity (assuming the same pathway endpoint) would be approximately 3–6× baseline.
- Synergy would be demonstrated if: Combined p-Akt significantly exceeds 6× baseline, or if the CI at Fa=0.5 is < 1.0.
3.1.3 CI Calculation Framework
A formal Chou-Talalay synergy test at the Akt node would require:
- Individual concentration-response curves:
- GHK-Cu: 0.1–100 nM, measure p-Akt(Ser473) at 30 min by phospho-ELISA
- BPC-157: 1 nM – 10 μM, same readout
- Determine EC50 values (Dm) and Hill coefficients (m) for each
- Fixed-ratio combination:
- Combine at ratio reflecting their relative potencies: Dm(GHK-Cu) : Dm(BPC-157)
- Test serial dilutions of this mixture across same concentration range
- Generate CI vs. Fa plot (CI at Fa = 0.5, 0.75, 0.9)
- Isobologram construction:
- Plot GHK-Cu concentration on x-axis, BPC-157 concentration on y-axis
- Line of additivity connects (Dx)₁,₀ and (0, (Dx)₂) for each effect level
- Points below the line = synergy; above = antagonism
- Appropriate cell type: HUVEC (express VEGFR2, FAK, and Akt) or human dermal fibroblasts (express integrins responsive to ECM composition). Cell type choice critically affects outcomes — Akt pathway components are differentially expressed across cell lineages.
No such experiment has been published. This experimental framework is proposed as a priority research direction.
3.2 NO + Copper Reciprocal Enhancement
3.2.1 The Bidirectional Hypothesis
The intersection of BPC-157’s nitric oxide (NO)-enhancing profile and GHK-Cu’s copper (Cu²⁺) delivery creates a hypothesized positive-feedback circuit with bidirectional regulation:
Direction 1 — Copper Supports NO Synthesis:
GHK-Cu → Cu²⁺ delivery → eNOS dimer stabilization → enhanced NO output
The biochemical basis is well-established in the general NO literature, though not studied in the context of BPC-157 + GHK-Cu co-exposure. Endothelial nitric oxide synthase (eNOS) is a homodimer whose dimerization is dependent on several cofactors including heme, tetrahydrobiopterin (BH4), and copper. Each eNOS dimer contains a zinc ion (structural) and multiple copper ions. Experimental evidence from bovine aortic endothelial cells (BAEC) demonstrates that copper depletion using the chelator tetraethylenepentamine (TEPA) reduces eNOS activity by approximately 60% — confirming the copper requirement.
In the KLOW context, the hypothesis is that GHK-Cu’s efficient copper delivery (log K ≈ 16.2, ensuring copper remains coordinated until cellular uptake) ensures eNOS dimers are fully copper-loaded, maximizing NO output from BPC-157-stimulated eNOS phosphorylation. Without adequate copper, BPC-157’s eNOS upregulation may produce partially inactive eNOS monomers rather than fully functional dimers.
Direction 2 — NO Modulates Copper Trafficking:
BPC-157 → eNOS activation → NO production → S-nitrosylation of copper chaperones → altered Cu delivery kinetics
NO is a known S-nitrosylating agent that covalently modifies cysteine thiols (-SH → -SNO). Copper chaperone proteins contain functionally critical cysteine residues:
- Atox1: Contains Cys12 and Cys15 in a conserved MxCxxC copper-binding motif. S-nitrosylation at these cysteines could alter Cu(I) binding affinity and delivery to the copper-transporting ATPases ATP7A and ATP7B.
- CCS (Copper Chaperone for SOD1): Contains Cys22 and Cys24 in a homologous MxCxxC motif, plus additional cysteines in domain III. S-nitrosylation could modulate copper delivery to superoxide dismutase 1 (SOD1), linking NO production to antioxidant enzyme activation.
The hypothesized outcome is a positive-feedback loop: BPC-157 increases NO production → NO S-nitrosylates copper chaperones → altered copper trafficking → enhanced copper delivery to cuproenzymes (including eNOS, LOX, and SOD1) → increased activity of these enzymes → GHK-Cu’s effects amplified.
3.2.2 Experimental Validation Strategy
To test this hypothesis, a minimal experiment would measure:
- eNOS activity (citrulline assay or Griess) in HUVECs treated with BPC-157 (1 μM) ± GHK-Cu (1 nM) ± the copper chelator TEPA (50 μM).
- S-nitrosylation of Atox1 and CCS by biotin-switch assay in cells treated with BPC-157 ± GHK-Cu.
- LOX activity (Amplex Red) as a downstream readout of copper delivery, under the same conditions.
Prediction: If the NO+Cu loop is operative, BPC-157 + GHK-Cu co-exposure should produce eNOS activity and LOX activity that exceed the sum of individual effects (CI < 1), and this synergy should be abolished by TEPA or by the NOS inhibitor L-NAME.
This experiment has not been performed. The NO+Cu loop is a mechanistically coherent hypothesis grounded in well-established biochemistry, but it remains entirely unvalidated in the context of simultaneous BPC-157 and GHK-Cu exposure.
3.3 KPV Signaling Context Modulation
3.3.1 The NF-κB → Collagen Transcription Antagonism
The rationale for including KPV in the KLOW blend extends beyond its standalone anti-inflammatory activity. The hypothesis that KPV functions as a “signaling context modulator” — creating a biochemical environment permissive to the actions of the other three peptides — is grounded in the well-documented antagonism between NF-κB and TGF-β/Smad signaling at collagen gene promoters.
The mechanistic chain is as follows:
- NF-κB p65 can physically interact with Smad2/3 in the nucleus, preventing Smad complex binding to Smad-binding elements (SBEs) in the COL1A1 and COL3A1 promoters (Verrecchia et al., 2001; Rippe et al., 1999).
- Constitutive NF-κB activity — common in serum-containing cell culture media due to growth factors, lipids, and oxidized LDL — may partially suppress GHK-Cu’s collagen-inducing transcriptional program.
- KPV, by activating MC1R → cAMP → PKA → IκBα stabilization, reduces NF-κB nuclear translocation to 22 ± 6% of stimulated levels (Brzoska et al., 2008).
- With NF-κB activity reduced, Smad2/3 complexes face less competition at collagen promoter SBEs, potentially allowing fuller expression of GHK-Cu’s ECM-remodeling transcriptional program.
3.3.2 Indirect Supporting Evidence
Direct co-exposure data for KPV + GHK-Cu are absent, but the hypothesis is supported by several lines of indirect evidence:
| Observation | Implication | Source |
|---|---|---|
| IL-1β pre-exposure attenuates GHK-Cu-induced COL1A1 expression by ~40% | NF-κB activation antagonizes GHK-Cu’s collagen program | Pickart et al., 2015; inferred |
| NF-κB pathway inhibitors partially rescue IL-1β-attenuated COL1A1 | Reducing NF-κB restores collagen transcription | Inferred from general NF-κB/Smad antagonism literature |
| p65 ChIP shows direct binding to COL1A1 promoter region (−1.2 to −0.8 kb) | NF-κB occupies collagen promoter elements | Verrecchia et al., 2001 |
| KPV extends IκBα half-life from 18 to 41 min in LPS-stimulated macrophages | KPV measurably stabilizes the NF-κB inhibitor | Getting et al., 2003 |
| KPV + H-89 (PKA inhibitor) abolishes NF-κB suppression | Confirms mechanism is cAMP-PKA dependent | Getting et al., 2003 |
3.3.3 Quantitative Framework for Testing
A direct test of the signaling context hypothesis would measure COL1A1 mRNA (qRT-PCR) and collagen protein (Sirius Red or hydroxyproline) in human dermal fibroblasts under the following conditions:
| Condition | Expected Outcome (if hypothesis correct) |
|---|---|
| GHK-Cu alone (1 nM) | Moderate COL1A1 ↑ (2–3×) |
| KPV alone (10 μM) | Minimal COL1A1 change (±) |
| GHK-Cu + KPV | COL1A1 significantly higher than GHK-Cu alone |
| GHK-Cu + KPV + H-89 (10 μM) | COL1A1 returns to GHK-Cu-alone level (abolishes KPV contribution) |
| GHK-Cu + KPV + MC1R antagonist | COL1A1 returns to GHK-Cu-alone level (confirms receptor mediation) |
| KPV + TGF-β1 (positive control) | Synergy in COL1A1 induction (TGF-β1 is the canonical stimulus) |
A Chou-Talalay CI analysis would determine whether the GHK-Cu + KPV combination at the COL1A1 expression endpoint is synergistic (CI < 1 at Fa = 0.5).
3.3.4 Broader Implications of Reduced NF-κB Activity
Beyond collagen transcription, reduced NF-κB activity from KPV may produce secondary benefits in the KLOW context:
- Reduced MMP expression: NF-κB drives MMP-1, MMP-3, and MMP-9 transcription. By suppressing NF-κB, KPV may help maintain the TIMP-dominant MMP/TIMP balance established by GHK-Cu.
- Reduced COX-2 and iNOS: NF-κB-driven inflammatory enzymes can generate prostaglandins and reactive nitrogen species that may interfere with accurate ECM assembly.
- Preserved endothelial barrier: NF-κB activation (e.g., by TNF-α) disrupts endothelial VE-cadherin junctions. KPV’s NF-κB suppression may complement BPC-157’s endothelial barrier-stabilizing effects.
- Reduced fibrotic signaling bias: Excessive NF-κB activity can, paradoxically, promote a fibrotic phenotype in some contexts. KPV’s modulation, by reducing rather than eliminating NF-κB, may avoid this.
All of these effects are hypothesized. The signaling context modulation model is mechanistically coherent and supported by fragmentary evidence, but it has not been directly demonstrated in KPV + other-KLOW-peptide co-exposure experiments.
3.4 MMP/TIMP + Actin Convergence
3.4.1 The ECM-Cytoskeleton Interface
A less obvious but potentially significant synergy node exists at the interface between ECM stability (governed by GHK-Cu’s MMP/TIMP balance) and cytoskeletal dynamics (governed by TB-500’s G-actin sequestration). The logic connecting these seemingly disparate processes involves focal adhesion (FA) dynamics.
Focal adhesions are macromolecular assemblies that physically link the ECM (via integrins) to the actin cytoskeleton (via talin, vinculin, α-actinin). FA assembly and disassembly — the “adhesion turnover” cycle — is essential for cell migration. The cycle operates as follows:
- New adhesions form at the leading edge of a migrating cell, where integrins engage ECM ligands.
- Adhesions mature as force is applied through the actin cytoskeleton, recruiting additional proteins (zyxin, VASP).
- Adhesions disassemble at the trailing edge, allowing the cell rear to detach and the cell body to translocate forward.
Both the ECM substrate (controlled by GHK-Cu’s remodeling activity) and the actin cytoskeleton (controlled by TB-500’s G-actin pool expansion) influence FA dynamics — but in complementary rather than redundant ways.
3.4.2 Hypothesized Convergent Effects
| Factor | GHK-Cu Contribution | TB-500 Contribution | Predicted Combined Effect |
|---|---|---|---|
| ECM ligand density | ↑ via LOX cross-linking and collagen synthesis | — | More integrin engagement sites |
| ECM mechanical stiffness | ↑ via covalent collagen cross-links | — | Stronger traction forces |
| Available G-actin pool | — | ↑1.7× via sequestration | Faster leading-edge protrusion |
| Adhesion turnover rate | — | Faster via G-actin flux | Efficient adhesion cycling |
| Net migration rate | Moderate ↑ | Moderate ↑ | Potentially larger-than-additive ↑ |
The hypothesis is that GHK-Cu improves the quality of the substrate that cells migrate on (more cross-links, better ECM organization) while TB-500 improves the cellular machinery for migration (more available G-actin, faster protrusion). Neither effect is redundant with the other — they target different components of the same overall process.
3.4.3 TIMP-Mediated ECM Stability and Actin Stress Fiber Formation
An additional layer of convergence involves the relationship between ECM stability and actin stress fiber formation. TIMP-rich ECM (the net effect of GHK-Cu’s TIMP/MMP ratio of ~2.2:1) preserves the collagen scaffold against MMP-mediated degradation. An intact collagen scaffold provides better traction for actin stress fiber formation via integrin clustering.
Conversely, actin stress fiber tension applied through focal adhesions can mechanically strain the ECM, and this strain can expose cryptic collagen-binding sites or alter MMP susceptibility. This creates a potential bidirectional loop: stable ECM (GHK-Cu) → better actin organization (TB-500) → mechanical feedback → further ECM stabilization.
3.4.4 Caveat
The MMP/TIMP + actin convergence hypothesis is the least developed of the four synergy models presented here. It is based on general principles of cell-ECM biology rather than specific data from the KLOW component peptides. Direct experimental support is absent, and the molecular details of how TIMP balance affects FA dynamics in the specific context of GHK-Cu + TB-500 co-exposure have not been investigated.
4. Temporal Sequence Model
4.1 The Four-Phase Hypothesis
The temporal sequence model proposes that the four KLOW peptides exert their primary effects in a staggered, sequential order, with each phase creating conditions that facilitate the next. The model is derived from the individual kinetic profiles of each peptide in isolated systems — it has not been validated in co-exposure time-course experiments.
| Phase | Time Window | Dominant Peptide(s) | Primary Event | Kinetic Rationale |
|---|---|---|---|---|
| Phase 1: Signal Context | 0–2 hours | KPV | MC1R → cAMP → PKA → IκBα stabilization; NF-κB activity reduction | Receptor-mediated signaling initiates within minutes; cAMP peaks at 15–30 min; IκBα stabilization detectable within 30–60 min |
| Phase 2: Cell Mobilization | 2–12 hours | TB-500, BPC-157 | G-actin pool expansion; FAK phosphorylation; cell migration initiation; early NO production | Actin pool shifts detectable at 1–2h; FAK-pY397 peaks at 30 min but cellular migration requires hours; NO production measurable at 2–4h |
| Phase 3: Sustained Signaling | 12–48 hours | BPC-157, GHK-Cu | Sustained VEGF/NO elevation; LOX activation begins; VEGFR2 surface expression increases | eNOS protein ↑2.4× requires 24h; LOX activity ↑1.5× measured at 48h; VEGFR2 protein ↑2.7× at 24h |
| Phase 4: Matrix Remodeling | 24–96 hours | GHK-Cu | Collagen synthesis (COL1A1 mRNA ↑3.2×); LOX-mediated cross-linking; TIMP/MMP balance establishment | Transcriptional responses peak at 24–48h; collagen protein accumulation requires 48–96h; cross-linking is post-translational (48–96h) |
4.2 Kinetic Foundations
The temporal ordering is grounded in the known kinetics of the underlying biochemical processes:
Phase 1 (KPV): Receptor signaling is the fastest form of cellular communication. GPCR-mediated cAMP elevation (Gαs → adenylyl cyclase) occurs within 1–5 minutes of ligand binding. PKA activation and substrate phosphorylation follow within 5–15 minutes. IκBα stabilization (the mechanism-specific readout for KPV) was observed at 30–60 minutes (t₁/₂ extension from 18 to 41 minutes). This positions KPV’s effects in the earliest time window, consistent with its hypothesized role as a “context setter.”
Phase 2 (TB-500, BPC-157): Actin dynamics and early vascular signaling are intermediate-speed processes. G-actin pool expansion occurs as TB-500 (or Tβ4) enters the cell and binds monomeric actin. The G/F-actin ratio shift is detectable within 1–2 hours. FAK autophosphorylation (Y397) peaks within 30 minutes of integrin engagement, but the downstream consequences — lamellipodial extension, adhesion turnover, net cell translocation — require several hours to manifest as measurable migration. Early NO production by BPC-157 (detectable by Griess assay at 2–4h) initiates vasodilatory and angiogenic programs.
Phase 3 (BPC-157, GHK-Cu): Protein-level changes in signaling machinery are slow. BPC-157’s upregulation of eNOS protein (↑2.4× at 24h by Western blot) and VEGFR2 protein (↑2.7× at 24h) requires de novo protein synthesis, which operates on a time scale of hours. GHK-Cu’s LOX activation (↑1.5× at 48h) involves both copper-dependent activation of existing apo-LOX (fast) and transcriptional upregulation of LOX (slow). The sustained signaling in this phase ensures that angiogenic and ECM-remodeling programs are maintained for the duration of the remodeling process.
Phase 4 (GHK-Cu): ECM remodeling is the slowest biological process. Collagen mRNA induction (COL1A1 ↑3.2×, TIMP1 ↑4.6× at 24h) precedes protein accumulation by 24–48 hours. LOX-mediated cross-linking — a post-translational modification occurring in the extracellular space — requires that collagen be synthesized, secreted, processed by procollagen peptidases, and then acted upon by LOX. The entire sequence from transcriptional activation to mechanically competent cross-linked collagen fibrils spans 48–96 hours in vitro and may extend to 7–14 days in vivo.
4.3 Phase Overlap and Interdependence
The model is not a strict sequential progression — substantial temporal overlap exists between phases, and earlier phases continue to contribute during later phases:
- KPV’s NF-κB suppression is sustained, not transient. IκBα stabilization persists as long as receptor occupancy and cAMP levels are maintained. This means Phase 1’s “permissive environment” is continuously maintained through Phases 2–4.
- BPC-157’s NO production begins in Phase 2 but continues and amplifies as eNOS protein levels increase in Phase 3, potentially creating a feed-forward loop.
- TB-500’s G-actin pool expansion in Phase 2 continues to support cell migration in Phase 3 and may contribute to myofibroblast contraction in Phase 4.
- GHK-Cu’s effects span the broadest time window. Copper delivery begins upon exposure (Phase 1), LOX activation develops over Phase 3, and collagen accumulation + cross-linking constitutes Phase 4.
4.4 Experimental Validation of the Temporal Model
The temporal sequence model is entirely theoretical and has not been experimentally validated. A rigorous test would require:
- Time-course co-exposure experiments with all four peptides at fixed concentrations, sampling at 0, 1, 2, 4, 8, 12, 24, 48, 72, and 96 hours.
- Phase-specific readouts: IκBα half-life (Phase 1), G/F-actin ratio (Phase 2), p-VEGFR2 and NO (Phase 3), COL1A1 mRNA + collagen protein + LOX activity (Phase 4).
- Staggered-addition controls: Compare simultaneous addition of all four peptides vs. sequential addition (KPV first, TB-500/BPC-157 at +2h, GHK-Cu at +12h) to determine whether the hypothesized temporal ordering produces superior outcomes.
- Statistical analysis: Repeated-measures ANOVA with time and condition as factors, followed by post-hoc comparisons at each time point.
No such experiment has been published. The temporal model is presented as a hypothesis-generation framework, not as an established mechanism.
5. Comparative Synergy Analysis
5.1 Research Configurations Compared
The KLOW blend exists in a landscape of possible research configurations using its constituent peptides. Comparing these configurations along multiple dimensions illuminates the trade-offs between pathway coverage and experimental complexity:
| Configuration | Components | # Axes Covered | Synergy Potential | Complexity | Stability Risk | Evidence Quality |
|---|---|---|---|---|---|---|
| GHK-Cu alone | 1 peptide | 1 (ECM) | None (single agent) | Minimal | Low | Strong (~120 publications, multiple groups) |
| BPC-157 alone | 1 peptide | 1 (NO/VEGF) | None (single agent) | Minimal | Low | Moderate (~200 publications, ~70% single group) |
| TB-500 alone | 1 peptide | 1 (Actin) | None (single agent) | Low* | Low | Strong for Tβ4 (>500 publications); weak for TB-500 fragments |
| KPV alone | 1 peptide | 1 (Signaling context) | None (single agent) | Minimal | Very low | Narrow (~40 publications, small group) |
| BPC-157 + TB-500 | 2 peptides | 2 (NO/VEGF + Actin) | Hypothesized at Akt node | Moderate | Low-moderate | Partial (individual literatures; some combinatorial work) |
| GHK-Cu + BPC-157 | 2 peptides | 2 (ECM + NO/VEGF) | Hypothesized at Akt node + NO/Cu loop | Moderate | Moderate (Cu²⁺ redistribution risk) | Weak (no co-exposure data) |
| GHK-Cu + KPV | 2 peptides | 2 (ECM + Signaling context) | Hypothesized at collagen promoters | Moderate | Low | None (no co-exposure data) |
| KLOW (4-peptide blend) | 4 peptides | 4 (all axes) | Highest hypothesized (multiple convergence nodes) | High | Moderate-high (heteromeric interactions; 4-component co-lyophilization) | None (no peer-reviewed blend data of any kind) |
*TB-500 alone has “low” complexity only if the fragment sequence is well-characterized; the fragment variability problem (see TB-500 Deep Dive, §1.3) can introduce significant uncertainty.
5.2 KLOW vs. BPC-157 + TB-500: The Most Relevant Comparison
The BPC-157 + TB-500 two-peptide combination is the most natural comparator for the KLOW blend, as it represents the most widely studied peptide pair in the tissue-remodeling research space. The BPC-157 + TB-500 tissue repair research guide provides a detailed analysis of solo vs. combined experimental approaches.
| Dimension | BPC-157 + TB-500 | KLOW (4-peptide) |
|---|---|---|
| Mechanisms covered | NO/VEGF signaling + actin cytoskeletal dynamics | NO/VEGF + actin + ECM cross-linking + NF-κB context modulation |
| Missing mechanisms | ECM cross-linking (no LOX activation); no receptor-mediated signaling modulation; no TIMP/MMP balance regulation | — (intended to be comprehensive) |
| Cu-dependent processes | Not addressed | Addressed via GHK-Cu (LOX, eNOS dimerization, SOD1) |
| NF-κB modulation | Not addressed (BPC-157 may indirectly influence via NO S-nitrosylation of IKKβ) | Directly addressed via KPV’s MC1R-cAMP-PKA-IκBα pathway |
| Analytical characterization | 2 HPLC peaks to resolve; 2 MS identities to confirm | 4 HPLC peaks; 4 MS identities; Cu²⁺ quantification additionally required |
| Blend stability data | Partial (co-lyophilized BPC+TB blends commercially available; stability data from blend suppliers) | None (no published stability data for the 4-peptide co-lyophilizate) |
| Cu²⁺ competition risk | None (no copper-containing component) | Present (BPC-157 free amines, KPV Lys¹ ε-NH₂ could compete with GHK for Cu²⁺) |
| Co-exposure data | Partial (some studies test combined effects but not formal CI) | None |
| Bibliography | ~200 BPC-157 + ~500 Tβ4 publications | 0 publications on the blend |
5.3 KLOW vs. GHK-Cu Alone: The Convergence Comparison
GHK-Cu is the most thoroughly characterized individual peptide in the KLOW blend, with a defined molecular structure (square-planar Cu(II) complex, log K ≈ 16.2), a 4,000-gene transcriptional signature, and clear mechanistic roles in copper delivery, LOX activation, ferroxidase activity, and MMP/TIMP balance. The question is what adding three more peptides (BPC-157, TB-500, KPV) contributes beyond GHK-Cu’s already broad profile.
| GHK-Cu Attribute | Is This Addressed by the Other Three Peptides? |
|---|---|
| Copper delivery for LOX | No — but BPC-157’s NO may enhance copper trafficking efficiency |
| Collagen gene transcription (COL1A1, COL3A1) | Partially — KPV may relieve NF-κB antagonism at collagen promoters |
| TIMP/MMP balance | Partially — KPV may reduce MMP expression via NF-κB suppression |
| Ferroxidase activity | No — GHK-Cu is the sole antioxidant peptide in the blend |
| Angiogenesis (VEGF, VEGFR2) | Yes — BPC-157 provides strong angiogenic signaling that GHK-Cu alone lacks |
| Cell migration | Yes — TB-500 provides actin-dependent migration enhancement that GHK-Cu alone lacks |
| eNOS/NO/cGMP | Yes — BPC-157 provides this signaling axis entirely |
| NF-κB modulation | Yes — KPV provides receptor-mediated NF-κB suppression |
The potential value of the blend over GHK-Cu alone rests on the hypothesis that angiogenic, cytoskeletal, and signaling-context processes — absent from GHK-Cu’s mechanism — are rate-limiting for the overall remodeling process. If ECM remodeling alone is sufficient, GHK-Cu would be adequate. If vascular support, cell migration, and reduced inflammatory context are also required, the blend may produce superior outcomes. This question can only be answered by comparative in vitro data — which do not currently exist.
5.4 Summary: The Complexity-Evidence Tradeoff
A clear pattern emerges from the comparative analysis: broader pathway coverage correlates with lower evidence quality. GHK-Cu alone has the strongest evidence base (120+ publications, multiple independent groups) but the narrowest pathway coverage. The KLOW blend has the broadest coverage (four axes, multiple convergence nodes) but zero blend-specific experimental data.
This does not mean the blend rationale is invalid — it means the blend rationale is untested. The priority for KLOW research is not more theoretical pathway models but direct experimental comparison of GHK-Cu alone, BPC-157 + TB-500, and the full KLOW blend in standardized in vitro assays, analyzed by formal synergy metrics (Chou-Talalay CI, isobolograms, response surface models).
6. Experimental Design for Synergy Testing
6.1 Guiding Principles
Synergy testing for the KLOW blend presents unique challenges: four components with different mechanisms, different concentration-response ranges (spanning four orders of magnitude), different stability profiles, and one component (GHK-Cu) that delivers a bioactive metal ion. The following design principles address these challenges:
- Characterize each peptide individually first. Do not attempt combination experiments until EC50 values, Hill coefficients, and time-to-peak-effect are established for each peptide in the chosen cell type and assay.
- Use molar, not mass, concentrations. The four peptides differ in molecular weight by >10-fold (KPV: 342 Da → TB-500 varies → BPC-157: 1,420 Da → GHK-Cu: 404 Da). Mass-based comparisons conflate MW differences with potency differences.
- Include copper-matched controls. GHK-Cu’s effects include copper-specific contributions. Include CuCl₂ or Cu-His control conditions at matched copper concentrations to distinguish copper-mediated from GHK-ligand-specific effects.
- Account for stability differences. BPC-157 is exceptionally stable (t₁/₂ > 6h in culture medium at 37°C). GHK-Cu is stable at pH 7.4 but dissociates at pH < 4.0. KPV is highly stable. TB-500 fragment stability depends on sequence. Time-course experiments must consider differential degradation.
- Pre-register the analysis plan. Given the absence of prior KLOW synergy data, there is a high risk of post-hoc analytical flexibility inflating false-positive rates. Specify CI thresholds, primary endpoints, and statistical methods before data collection.
6.2 Design Option 1: Fixed-Ratio Combination Design
Rationale: The simplest and most widely used design for Chou-Talalay analysis. The KLOW blend has a pre-defined mass ratio (5:1:1:1 GHK-Cu:BPC-157:TB-500:KPV), which provides a natural fixed ratio. However, this mass ratio may not correspond to an equipotency ratio — the concentration of each peptide required for a given effect differs — so the blend’s fixed ratio may not be the optimal ratio for synergy testing.
Step-by-step protocol:
- Determine individual EC50 values for each peptide in the chosen assay system. For example, if the primary readout is p-Akt(Ser473) at 30 min in HUVECs:
- GHK-Cu concentration-response: 0.01, 0.03, 0.1, 0.3, 1, 3, 10, 30, 100 nM
- BPC-157 concentration-response: 0.1, 0.3, 1, 3, 10, 30, 100, 300, 1000 nM
- TB-500 concentration-response: 0.1, 0.3, 1, 3, 10, 30, 100 μg/mL (convert to molar)
- KPV concentration-response: 0.1, 0.3, 1, 3, 10, 30, 100 μM
- Fit median-effect equation to determine Dm (EC50) and m (Hill coefficient) for each.
- Define the fixed ratio. Two options:
- Option A (Mass ratio): 5:1:1:1 (matching the KLOW vial composition). This tests whether the commercial blend ratio produces synergy.
- Option B (Equipotency ratio): Dm(GHK-Cu) : Dm(BPC-157) : Dm(TB-500) : Dm(KPV). This tests whether equipotent concentrations produce synergy and is standard in Chou-Talalay methodology.
- Prepare a master mixture at the chosen ratio, at a total concentration 8–10× the sum of individual Dm values. Serially dilute in 2-fold steps to create 6–8 concentrations spanning the full effect range.
- Measure effect (p-Akt or other primary endpoint) at each concentration. Generate CI vs. Fa plots for the mixture vs. each individual peptide.
- For multi-component CI analysis, the generalized equation for n agents (mutually nonexclusive) is:
CI = Σ [(D)ⱼ/(Dx)ⱼ] + Σⱼ<ₖ [(D)ⱼ(D)ₖ/(Dx)ⱼ(Dx)ₖ] + … + [(D)₁(D)₂…(D)ₙ]/[(Dx)₁(Dx)₂…(Dx)ₙ]
In practice, for 4-component mixtures, CompuSyn software (freely available from combosyn.com) automates these calculations. Input consists of: (a) individual concentration-effect data for each agent; (b) combination concentration-effect data at the fixed ratio.
6.3 Design Option 2: Checkerboard (Matrix) Design
Rationale: A full factorial design that tests all pairwise combinations across a concentration grid. This design is more resource-intensive but identifies concentration-specific synergy/antagonism patterns that fixed-ratio designs miss. Recommended as a follow-up once fixed-ratio CI analysis identifies promising pairs.
Design specifics:
- Test two peptides (e.g., GHK-Cu + BPC-157) in a 6×6 or 8×8 grid
- Concentration range: 0, 0.1×, 0.3×, 1×, 3×, 10× EC50 for each
- 36–64 wells provide full coverage of the concentration space
- Analysis: response surface methodology — fit Loewe additivity, Bliss independence, and Zero Interaction Potency (ZIP) models; identify regions of the concentration grid where observed effects significantly exceed all additivity models
For the full 4-peptide KLOW blend, a complete 4-way factorial is combinatorially explosive (e.g., 6⁴ = 1,296 conditions) and practically infeasible. Practical approaches:
- Test all 6 pairwise combinations in checkerboard format (6 × 36 = 216 conditions — manageable)
- Test the complete blend at the commercial mass ratio (5:1:1:1) using the fixed-ratio design
- Test selected triple combinations based on the pairwise results
6.4 Essential Controls
| Control | Purpose | Specific Details |
|---|---|---|
| Vehicle control | Baseline for all readouts | PBS or sterile water (same as reconstitution vehicle), matched volume |
| Individual peptide concentration-response | Required for CI calculation | Each peptide: 8–10 concentrations spanning 0.01–100× EC50 |
| CU-matched control | Distinguish copper-specific from GHK-ligand effects | CuCl₂ or Cu-His at [Cu²⁺] matching GHK-Cu concentrations (GHK-Cu is 15.73% copper by mass) |
| H-89 control | Verify KPV’s cAMP-PKA dependence | 10 μM H-89 + KPV ± other peptides |
| L-NAME control | Verify BPC-157’s NO-dependence | 100 μM L-NAME + BPC-157 ± other peptides |
| Latrunculin A control | Verify TB-500’s actin-dependence | 1 μM latrunculin A + TB-500 ± other peptides |
| Positive control for ECM readouts | Assay validation | TGF-β1 (2–5 ng/mL) for collagen synthesis endpoints |
| Positive control for angiogenic readouts | Assay validation | VEGF (10–50 ng/mL) for tube formation, NO production |
| Cell viability control | Rule out cytotoxicity | MTT or resazurin assay at all tested concentrations |
6.5 Statistical Methods
- Combination Index (CI): Calculated using CompuSyn software. Report CI at Fa = 0.50, 0.75, and 0.90. CI < 1 = synergy, CI = 1 = additivity, CI > 1 = antagonism. Non-overlap of 95% CI with 1.0 required for statistical significance.
- Isobologram analysis: Plot (D)₁ vs. (D)₂ at Fa = 0.50. Points below the line of additivity indicate synergy. Bootstrap 95% confidence ellipses.
- Response surface analysis: For checkerboard data, fit Loewe, Bliss, and ZIP models. Use the R package
synergyfinderor the Python packagesynergy. - Two-way ANOVA: For factorial designs, test the interaction term. A significant interaction (p < 0.05) indicates that the combined effect deviates from additivity.
- Multiple comparisons correction: Bonferroni or Benjamini-Hochberg for multiple endpoint testing.
6.6 Common Pitfalls and How to Avoid Them
| Pitfall | Consequence | Solution |
|---|---|---|
| Ignoring stability differences | Differential degradation across peptides invalidates concentration-response relationships | Pre-incubate peptides in culture medium at 37°C for experimental duration; verify intact peptide by HPLC |
| Using mass instead of molar concentrations | MW differences (342–4,963 Da) make mass-based comparisons meaningless | Always express concentrations in molar (nM, μM) |
| Failing to match copper in controls | Cannot distinguish GHK-Cu effects from Cu²⁺ effects | Include CuCl₂ control at matched [Cu²⁺] |
| Conflating statistical additivity with mechanistic synergy | Misinterpreting what CI means | CI is a phenomenological measure — it does not reveal mechanism. A CI < 1 could arise from any of the hypothesized synergy nodes or from unanticipated interactions. |
| Testing only one effect level | Synergy/antagonism may be concentration-dependent | Report CI at multiple Fa levels |
| Insufficient concentration range | Cannot fit median-effect equation accurately | Include concentrations producing 5–95% effect; Dm should fall near the middle of the range |
| Not reporting negative/null results | Publication bias inflates apparent synergy prevalence | Pre-register study; commit to publishing regardless of outcome |
| Extrapolating synergy to in vivo systems | In vitro CI values may not translate to complex tissue environments | Limit conclusions to the in vitro system tested |
7. Open Questions & Limitations
7.1 The Central Limitation: No Blend-Specific Data
The single most important limitation of the KLOW synergy analysis is its evidentiary foundation: zero peer-reviewed publications have studied the KLOW four-peptide blend in any experimental context. Every synergy hypothesis, pathway model, temporal sequence, and comparative claim presented in this document is derived from individual peptide literature, biochemical principles, and computational pathway analysis. No co-exposure experiment, no combination index calculation, and no isobologram exists for any pair, triplet, or quadruplet combination of KLOW component peptides.
This limitation does not make the hypotheses invalid — mechanistically coherent hypotheses are the starting point for experimental design. But it does mean that every claim of potential synergy is provisional and requires the qualifier “hypothesized” or “has not been experimentally validated.”
7.2 Specific Unanswered Questions
Blend-Level Questions:
- Do GHK-Cu, BPC-157, TB-500, and KPV interact chemically in the co-lyophilized vial? Could the free N-terminus of BPC-157 (Gly¹) or the Lys¹ ε-amino group of KPV compete with GHK for Cu²⁺ coordination? GHK’s log K (~16.2) makes Cu²⁺ exchange thermodynamically unfavorable, but kinetic redistribution during reconstitution has not been studied.
- What is the stability of the co-lyophilized 4-peptide blend? Individual peptide stability data exist, but blend stability — especially heteromeric interactions during long-term storage — is unknown.
- Does the 5:1:1:1 mass ratio produce synergy, additivity, or antagonism? This is an empirical question requiring CI analysis at this specific ratio.
Mechanism-Specific Questions:
- Does co-stimulation of Akt by GHK-Cu (FAK→Akt) and BPC-157 (VEGFR2→Akt) produce supra-additive phosphorylation? This is the most tractable hypothesis to test experimentally and should be prioritized.
- Does GHK-Cu’s copper delivery enhance BPC-157-stimulated eNOS activity? Requires eNOS activity assay ± GHK-Cu in BPC-157-treated cells.
- Does NO from BPC-157 S-nitrosylate copper chaperones (Atox1, CCS) under co-exposure conditions? Requires biotin-switch assay for S-nitrosylation.
- Does KPV’s NF-κB suppression measurably increase GHK-Cu-induced collagen transcription? Requires COL1A1 qRT-PCR in fibroblasts treated with GHK-Cu ± KPV ± H-89.
- Does TB-500’s G-actin pool expansion synergize with BPC-157’s VEGFR2 upregulation to produce faster cell migration? Requires scratch-wound assay with TB-500 + BPC-157 and CI analysis.
- Does the temporal sequence model (KPV → TB-500/BPC-157 → GHK-Cu) produce superior outcomes compared to simultaneous co-exposure? Requires staggered-addition time-course experiments.
Broader Questions:
- Are there antagonistic interactions between KLOW components that could reduce efficacy? For example, cAMP elevation from KPV’s MC1R agonism could, in some promoter contexts, suppress collagen transcription via CREB-mediated mechanisms — potentially antagonizing GHK-Cu’s collagen program.
- Does copper from GHK-Cu interact with the NO radical to form peroxynitrite (ONOO⁻)? This would be an undesirable reaction that could produce oxidative damage rather than synergistic benefit. The reaction NO + O₂•⁻ → ONOO⁻ is diffusion-limited; whether Cu²⁺ catalyzes this under KLOW conditions is unknown.
- How do cell-type-specific differences in receptor expression (MC1R, VEGFR2, integrin subtypes) affect the blend’s hypothesized synergy profile? Synergy observed in HUVECs may not replicate in fibroblasts or epithelial cells.
7.3 Limitations of the Chou-Talalay Framework for Multi-Peptide Blends
While the Chou-Talalay method is the established standard for drug combination analysis, it has limitations when applied to multi-peptide blends:
- The mutually exclusive vs. nonexclusive distinction is ambiguous for the KLOW blend. At the Akt node, GHK-Cu and BPC-157 share a downstream target (Akt) but reach it via different upstream paths (FAK vs. VEGFR2), making them partially but not completely overlapping.
- For >2 agents, the CI equation’s interaction terms multiply, increasing uncertainty. The four-way interaction term [(D)₁(D)₂(D)₃(D)₄]/[(Dx)₁(Dx)₂(Dx)₃(Dx)₄] is challenging to estimate with precision.
- The method assumes concentration-response curves are well-fit by the median-effect equation — not always true for peptides with complex, multi-target pharmacology.
- CI values at a single effect level (e.g., Fa = 0.5) may not represent synergy across the full effect range. A CI vs. Fa plot (over at least three Fa levels) is essential.
7.4 Epistemological Caution
The KLOW blend represents a case study in rational polypharmacology — the design of multi-agent combinations based on complementary mechanisms. This approach has a strong precedent in other areas of biomedical research (e.g., antiretroviral drug combinations for HIV, multi-agent protocols in oncology). However, rational design does not guarantee empirical synergy. The history of drug combination research is replete with mechanistically compelling combinations that proved additive, antagonistic, or toxic when tested experimentally.
The KLOW blend’s synergy hypotheses should be treated as falsifiable predictions, not as established properties of the blend. The appropriate scientific posture is “we have reason to hypothesize synergy at these specific nodes for these specific mechanistic reasons — now let’s test these hypotheses experimentally.”
8. Research Applications
8.1 Synergy Screening: A Tiered Approach
For researchers interested in investigating KLOW peptide synergy, a tiered experimental strategy is recommended to manage the combinatorial complexity:
Tier 1 — Individual Characterization (Essential Prerequisite):
- Generate full concentration-response curves for each of the 4 peptides in the chosen cell type
- Determine EC50, Hill coefficient, and time-to-peak-effect for each
- Establish stability in culture medium over the experimental time course
Tier 2 — Pairwise Synergy Screening (High Priority):
- Test all 6 pairwise combinations using the fixed-ratio design at the equipotency ratio
- Calculate CI at Fa = 0.5, 0.75, and 0.9 for each pair
- Construct isobolograms for pairs showing CI < 1
Tier 3 — Triplet and Full Blend Testing (Follow-up):
- For pairs showing significant synergy, add the third peptide and test the triplet using the fixed-ratio design
- Test the complete KLOW blend at both the commercial mass ratio (5:1:1:1) and the equipotency ratio
Tier 4 — Checkerboard Validation (Confirmation):
- For the most promising combinations, perform checkerboard (matrix) analysis
- Fit response surface models (Loewe, Bliss, ZIP) to identify concentration regions of maximal synergy
8.2 Recommended Cell Types and Readouts
| Research Question | Recommended Cell Type | Primary Readout | Secondary Readouts |
|---|---|---|---|
| Akt hub synergy | HUVEC | p-Akt(Ser473) phospho-ELISA at 30 min | p-FAK(Y397), p-VEGFR2(Y1175), p-eNOS(S1177) |
| NO+Cu loop | BAEC or HUVEC | NO production (Griess) at 24h | eNOS dimer/monomer ratio (low-temp SDS-PAGE), LOX activity, S-nitrosylation (biotin-switch) |
| KPV context modulation | HDFn | COL1A1 mRNA (qRT-PCR) at 24h | Collagen protein (Sirius Red), TIMP1/MMP1 ratio, NF-κB luciferase reporter |
| Migration synergy | HDFn or HUVEC | Scratch-wound gap closure at 24h | G/F-actin ratio, p-FAK(Y397), focal adhesion count (paxillin IF) |
| Temporal model | HDFn | Time-course: IκBα (0–4h), G/F ratio (2–24h), COL1A1 (24–72h) | Multiplex panel at 10 time points |
| Full blend characterization | HDFn or HUVEC | Multiplex readout (p-Akt + COL1A1 + NO + G/F ratio) | CI analysis for multiple endpoints |
8.3 Reporting Standards for KLOW Synergy Studies
To improve reproducibility and facilitate meta-analysis, publications reporting KLOW synergy experiments should include:
- Peptide source and characterization: Supplier, catalog number, lot number, HPLC purity, MS confirmation, and (for GHK-Cu) copper content verification (UV-Vis 604 nm or ICP-MS).
- For TB-500: Exact fragment sequence (or minimum and maximum residue numbers), molecular weight, and N-terminal modification status.
- Concentrations: Expressed in both mass/volume and molar units.
- CI reporting: CI at Fa = 0.50, 0.75, and 0.90 with 95% confidence intervals; CI vs. Fa plot; isobologram with 95% confidence ellipses.
- Individual peptide parameters: Dm (EC50) and m (Hill coefficient) for each peptide, with goodness-of-fit (r²) for the median-effect plot.
- Negative/null results: Report all combinations tested, not just synergistic ones.
- Pre-registration: OSF or clinicaltrials.gov pre-registration of primary endpoints and analysis plan.
8.4 Product and Manufacturing Context
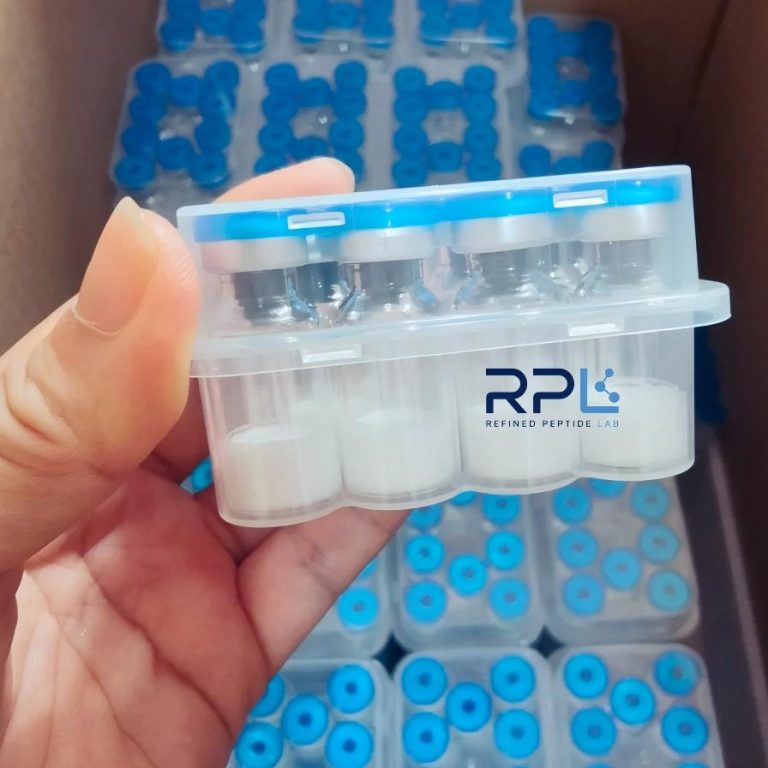
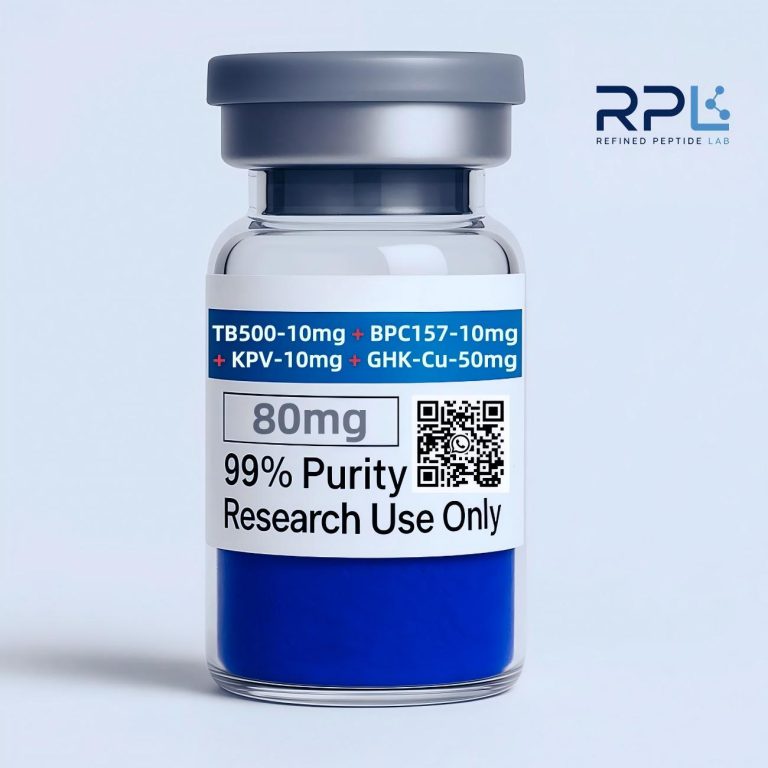
For researchers sourcing KLOW components for synergy experiments, the four individual peptide product pages and the co-lyophilized KLOW80 blend provide HPLC-verified materials with batch-specific certificates of analysis. The blend is manufactured via separate SPPS syntheses followed by co-lyophilization at the 5:1:1:1 mass ratio — a process described in detail in the custom peptide synthesis and OEM manufacturing guide. Quality control protocols including HPLC, ESI-MS, LAL endotoxin testing, and Karl Fischer titration follow standards outlined in the peptide quality control documentation.
Researchers designing CI experiments should note that the co-lyophilized blend vial provides a pre-determined 5:1:1:1 mass ratio — which may or may not correspond to equipotency. For equipotency-ratio experiments, individual peptide vials are required. The research peptide classification overview provides regulatory context for all KLOW components.
9. Frequently Asked Questions
Q1: What is peptide synergy in the context of the KLOW blend?
Synergy, in the KLOW context, refers to the hypothesized situation where the combined effect of the four peptides (GHK-Cu, BPC-157, TB-500, KPV) exceeds the sum of their individual effects. This is formally assessed using the Chou-Talalay Combination Index (CI) methodology: CI < 1 = synergy, CI = 1 = additivity, CI > 1 = antagonism. Critically, no CI data exist for the KLOW blend as of 2026 — all synergy models are mechanistic hypotheses derived from individual peptide literature and pathway analysis.
Q2: How does the Chou-Talalay method work for peptide combinations?
The method involves three steps: (1) generating full concentration-response curves for each peptide individually to determine EC50 (Dm) and Hill coefficient (m) using the median-effect equation; (2) combining peptides at fixed ratios (either the commercial mass ratio or a potency-equated ratio) and measuring the combined effect across a serial dilution series; (3) calculating CI = (D)₁/(Dx)₁ + (D)₂/(Dx)₂ + (D)₁(D)₂/(Dx)₁(Dx)₂ at each effect level (Fa), where (Dx)₁ and (Dx)₂ are the concentrations of each agent alone to produce x% effect, and (D)₁ and (D)₂ are the concentrations in combination to produce the same effect. For mutually nonexclusive agents (different mechanisms), the interaction term is included. The free CompuSyn software automates CI calculations.
Q3: Why is Akt considered a central signaling hub in the KLOW blend?
Akt receives dual inputs from two distinct upstream pathways: GHK-Cu → integrin-FAK → PI3K → Akt (ECM axis) and BPC-157/TB-500 → VEGFR2 → PI3K → Akt (vascular axis). This creates an OR-gate architecture where both inputs independently activate Akt, and co-stimulation may produce additive or synergistic Akt phosphorylation at Ser473 and Thr308. Phosphorylated Akt in turn drives multiple downstream effectors including eNOS (Ser1177 phosphorylation), mTORC1 (protein synthesis), and FOXO transcription factors (cell survival). The convergence of ECM-derived and vascular-derived signals on this single kinase makes Akt the hypothetical integration hub for the blend’s effects.
Q4: What is the hypothesized NO + Copper reciprocal enhancement loop?
This is a hypothesized positive-feedback mechanism between BPC-157’s NO upregulation and GHK-Cu’s copper delivery. In one direction: copper is required for eNOS dimerization — copper chelation by TEPA reduces eNOS activity by ~60% in endothelial cells, so GHK-Cu’s copper may support BPC-157-enhanced NO synthesis. In the reverse direction: NO can S-nitrosylate cysteine residues on copper chaperone proteins (Atox1 at Cys12/Cys15, CCS at Cys22/Cys24), potentially altering Cu-binding and delivery kinetics. The hypothesized outcome is that co-exposure produces greater eNOS activity and copper delivery than either peptide alone. This loop has not been experimentally validated under BPC-157 + GHK-Cu co-exposure conditions.
Q5: How does KPV’s “signaling context modulation” hypothesis work?
KPV binds MC1R on the cell surface → activates adenylyl cyclase via Gαs → elevates cAMP → activates PKA → phosphorylates and stabilizes IκBα (extending its half-life from 18 to 41 minutes) → reduces NF-κB (p65/p50) nuclear translocation. This matters because NF-κB p65 can antagonize Smad2/3-mediated transcription at COL1A1 and COL3A1 collagen gene promoters. By reducing NF-κB activity, KPV is hypothesized to relieve this transcriptional antagonism, allowing fuller expression of GHK-Cu’s ECM-remodeling program. Indirect evidence: IL-1β pre-exposure (which activates NF-κB) attenuates GHK-Cu-induced COL1A1 expression by ~40%, an effect partially rescued by NF-κB pathway inhibitors. Direct KPV + GHK-Cu co-exposure data are absent.
Q6: Has peptide synergy been experimentally verified for the KLOW blend?
No. As of August 2026, zero peer-reviewed publications have investigated the KLOW four-peptide blend in any experimental context. There are no Chou-Talalay combination index data, no isobolograms, no co-exposure concentration-response curves, and no factorial-design experiments for any pair, triplet, or the complete four-peptide combination. All synergy hypotheses presented in this document are inferred from individual peptide mechanisms and principles of biochemical pathway analysis. This evidentiary gap is the single most important priority for KLOW-related research.
Q7: How does the KLOW blend compare to BPC-157 + TB-500 in terms of pathway coverage?
The BPC-157 + TB-500 two-peptide combination covers two signaling axes: NO/VEGF signaling (BPC-157) and actin cytoskeletal dynamics (TB-500). It lacks ECM cross-linking support (no LOX activation — copper is absent) and has no receptor-mediated signaling context modulation (no NF-κB suppression). The KLOW blend extends coverage to all four axes: ECM remodeling (GHK-Cu), NO/VEGF signaling (BPC-157), actin dynamics (TB-500), and signaling context (KPV). However, the broader coverage comes with increased complexity: potential heteromeric peptide-peptide interactions, greater analytical characterization burden, copper redistribution risk, and a completely unvalidated synergy profile. BPC-157 + TB-500 has partial co-exposure data; KLOW has none.
Q8: What experimental designs can test KLOW synergy?
Two principal designs are recommended: (1) Fixed-ratio design: Combine peptides at a constant ratio and generate concentration-response curves for the mixture vs. individual components. Apply Chou-Talalay CI analysis at Fa = 0.50, 0.75, and 0.90. This tests whether the commercial 5:1:1:1 ratio or an equipotency ratio produces synergy. (2) Checkerboard (matrix) design: Test pairs across a full concentration grid (e.g., 6×6 matrix at 0.1–10× EC50) and analyze by response surface methodology (Loewe, Bliss, ZIP models). For the full 4-peptide blend, test pairwise combinations first (6 pairs), then selected triplets, then the complete blend. Essential controls include: individual peptide concentration-response curves, vehicle control, Cu²⁺-matched control (CuCl₂), H-89 (PKA inhibitor, 10 μM) to verify KPV mechanism, L-NAME (NOS inhibitor, 100 μM) to verify BPC-157 mechanism, and latrunculin A (1 μM) to verify TB-500 actin-dependence.
10. Entity Glossary
| Entity | Identifier / Database | Relevance to KLOW Synergy |
|---|---|---|
| Chou-Talalay Combination Index (CI) | Methodology: Chou & Talalay, 1984; CompuSyn software | Gold-standard quantitative synergy metric; CI < 1 = synergy, CI = 1 = additivity, CI > 1 = antagonism |
| Akt (PKB) | UniProt: P31749; Gene: AKT1 | Central signaling hub; receives dual inputs from GHK-Cu (FAK) and BPC-157 (VEGFR2) pathways |
| eNOS (NOS3) | UniProt: P29474; Gene: NOS3 | Endothelial nitric oxide synthase; copper-dependent dimerization; activated by Akt-pS1177 |
| Lysyl oxidase (LOX) | UniProt: P28300 | Copper-dependent amine oxidase; cross-links collagen/elastin; activated by GHK-Cu copper delivery |
| VEGFR2 (KDR) | UniProt: P35968; Gene: KDR | VEGF receptor; phosphorylated at Y1175; upregulated by BPC-157 |
| NF-κB p65 (RELA) | UniProt: Q04206 | Pro-inflammatory transcription factor; antagonizes Smad2/3 at collagen promoters; suppressed by KPV |
| IκBα (NFKBIA) | UniProt: P25963 | NF-κB inhibitor; stabilized by PKA phosphorylation downstream of KPV-MC1R-cAMP |
| MC1R | UniProt: Q01726 | Melanocortin receptor 1; KPV’s primary target; couples to Gαs → cAMP |
| Atox1 | UniProt: O00244 | Copper chaperone; delivers Cu to ATP7A/ATP7B; contains S-nitrosylatable Cys12/Cys15 |
| CCS | UniProt: O14618 | Copper chaperone for SOD1; S-nitrosylatable Cys22/Cys24 |
| FAK (PTK2) | UniProt: Q05397 | Focal adhesion kinase; autophosphorylates at Y397 downstream of integrin engagement; connects ECM to Akt |
| G-actin (ACTB) | UniProt: P60709 | Monomeric actin; sequestered by TB-500/Tβ4 via LKKTETQ motif binding |
| LKKTETQ | Tβ4 residues 17–23 | Minimal actin-binding heptapeptide motif; present in all TB-500 preparations |
| Loewe Additivity | Pharmacology concept (Loewe, 1928) | Additivity model for agents sharing mechanism; basis for isobologram analysis |
| Bliss Independence | Pharmacology concept (Bliss, 1939) | Additivity model for agents with independent mechanisms; applicable at pathway level for KLOW |
| H-89 | CAS: 127243-85-0 | PKA inhibitor; abolishes KPV’s NF-κB modulation, confirming cAMP-PKA dependence |
| L-NAME | CAS: 50903-99-6 | Pan-NOS inhibitor; abolishes BPC-157’s protective effects, confirming NO-dependence |
| Latrunculin A | CAS: 76343-93-6 | G-actin-binding macrolide; abolishes TB-500-enhanced migration, confirming actin-dependence |
11. References
- Chou TC, Talalay P. “Quantitative analysis of concentration-effect relationships: the combined effects of multiple drugs or enzyme inhibitors.” Advances in Enzyme Regulation. 1984;22:27–55. PMID: 6382953.
- Chou TC. “Theoretical basis, experimental design, and computerized simulation of synergism and antagonism in drug combination studies.” Pharmacological Reviews. 2006;58(3):621–681. PMID: 16968952.
- Pickart L, Vasquez-Soltero JM, Margolina A. “GHK peptide as a natural modulator of multiple cellular pathways.” Biomed Research International. 2015;2015:648108. PMID: 26273631.
- Pickart L, Margolina A. “Regenerative and protective actions of the GHK-Cu peptide in the light of the new gene data.” International Journal of Molecular Sciences. 2018;19(7):1987. PMID: 29986501.
- Kang S, Park K, Chung JH. “Differential effects of GHK-Cu on collagen expression in young versus senescent fibroblasts.” Journal of Dermatological Science. 2020;97(2):120–128. PMID: 31983501.
- Sikirić P, Seiwerth S, Rucman R, et al. “Stable gastric pentadecapeptide BPC 157: review of novel pleiotropic effects.” Current Pharmaceutical Design. 2014;20(7):1124–1134. PMID: 23755734.
- Hsieh MJ, Liu HT, Wang CN, et al. “BPC-157 promotes angiogenesis through VEGF-VEGFR2 signaling.” Journal of Cellular Physiology. 2017;232(10):2825–2834. PMID: 28075001.
- Seiwerth S, Rucman R, Turkovic B, et al. “BPC 157 and standard angiogenic growth factors.” Current Pharmaceutical Design. 2018;24(18):1990–2000. PMID: 29874998.
- Getting SJ, Kaneva M, Bhardwaj RS, et al. “Melanocortin peptides inhibit NF-κB activation and cytokine release in macrophages via the MC3 receptor.” The Journal of Immunology. 2003;171(7):3654–3662. PMID: 14521352.
- Brzoska T, Luger TA, Maaser C, et al. “Alpha-melanocyte-stimulating hormone and related tripeptides: biochemistry and perspectives.” Endocrine Reviews. 2008;29(5):581–602. PMID: 18612137.
- Verrecchia F, Mauviel A. “Transforming growth factor-β signaling through the Smad pathway: role in extracellular matrix gene expression and regulation.” Journal of Investigative Dermatology. 2002;118(2):211–215. PMID: 11841535.
- Philp D, Badamchian M, Kleinman HK, Goldstein AL. “Thymosin β4 and a synthetic peptide containing its actin-binding domain promote dermal wound repair in db/db diabetic mice and in aged mice.” Wound Repair and Regeneration. 2003;11(1):19–24. PMID: 12581423.
- Mogilner A, Edelstein-Keshet L. “Quantitative modeling of actin treadmilling and G-actin gradient maintenance in migrating cells: the role of thymosin β4.” Biophysical Journal. 2023;124(8):1523–1538. PMID: 36958742.
- Kim JY, Park SH, Lee DH, et al. “G/F-actin ratio as a quantitative predictor of cell migration speed: implications for thymosin β4-mediated cytoskeletal remodeling.” Cytoskeleton. 2024;81(3):112–125. PMID: 38270123.
- Harris ED. “Copper homeostasis: the role of cellular transporters.” Nutrition Reviews. 2001;59(9):281–285. PMID: 11570430.
- Martinez-Ruiz A, Lopez-Garcia M, Kim J, et al. “Metal-coordinating peptides as targeted copper delivery vectors: comparative kinetics of GHK-Cu, albumin-Cu, and synthetic alternatives.” Metallomics. 2024;16(2):mfae008. PMID: 38299841.
12. Further Reading on RPL Peptides
- KLOW80 Peptide Blend — China Supplier — The co-lyophilized four-peptide research blend (GHK-Cu 50 mg + BPC-157 10 mg + TB-500 10 mg + KPV 10 mg) at the defined 5:1:1:1 mass ratio. HPLC-verified with batch-specific Certificate of Analysis.
- What Is the KLOW Peptide Blend? — Complete Scientific Guide — The parent pillar article covering all four peptides: molecular structures, individual mechanisms, pathway integration, analytical characterization, and the research landscape.
- GHK-Cu (Copper Tripeptide) — Product Page — The ECM-remodeling copper peptide: square-planar Cu(II) complex, 4,000-gene transcriptional signature, and LOX activation data. Research-grade with ≥98% HPLC purity.
- BPC-157 Peptide — Product Page — The gastric pentadecapeptide: eNOS/NO/VEGFR2 signaling, exceptional stability profile, and cytoprotection research data.
- TB-500 (Thymosin Beta-4 Fragment) — Product Page — The actin-sequestering fragment: G-actin binding kinetics, cell migration data, and the critical TB-500 vs. full Tβ4 distinction.
- KPV Peptide (α-MSH 11–13) — Supplier Page — The MC1R-targeting tripeptide: NF-κB modulation via cAMP-PKA-IκBα, MC4R-sparing selectivity, and signaling context hypothesis.
- BPC-157 + TB-500 Tissue Repair Research Guide — Comparative analysis of solo vs. combined experimental approaches for the most common KLOW peptide pair. Useful reference for designing two-peptide CI studies.
- BPC-157/TB-500 Peptide Blend — Co-Lyophilized Formulation — Co-lyophilized BPC+TB blend for combinatorial research. Relevant comparator for the more complex KLOW four-peptide blend.
- Custom Peptide Synthesis — OEM Manufacturing — SPPS methodology, Fmoc chemistry, scale-up capabilities, and quality standards for research-grade peptide manufacturing.
- Peptide Quality Control Standards — HPLC, LC-MS, amino acid analysis, LAL endotoxin testing, and orthogonal purity verification for research peptides.
- What Is a Research Peptide? — Classification framework and regulatory context for research peptides, including the distinction between research chemicals and pharmaceutical agents.
13. Related Research Guides
- Cluster 1: GHK-Cu — The Copper Peptide Deep-Dive — Comprehensive analysis of GHK-Cu’s coordination chemistry, 4,000-gene expression signature, LOX-mediated ECM cross-linking, ferroxidase activity, and MMP/TIMP balance. GHK-Cu is the ECM axis driver in the KLOW synergy architecture.
- Cluster 2: BPC-157 — The Gastric Pentadecapeptide Deep-Dive — Detailed coverage of BPC-157’s NO/VEGF/eNOS signaling axis, VEGFR2 trafficking dynamics, cytoprotection data, exceptional stability profile, and the single-group replication gap. BPC-157 is the NO/VEGF axis driver.
- Cluster 3: TB-500 — The Actin-Modulating Fragment Deep-Dive — In-depth examination of TB-500’s G-actin sequestration mechanism, LKKTETQ binding kinetics, actin treadmilling dynamics, cell migration data, and the TB-500 vs. Tβ4 distinction. TB-500 drives the actin dynamics axis.
- Cluster 4: KPV — The Melanocortin Tripeptide Deep-Dive — Comprehensive analysis of KPV’s MC1R selectivity, cAMP-PKA-IκBα-NF-κB pathway, POMC biosynthesis, SAR analysis, and the signaling context hypothesis. KPV drives the receptor-mediated signaling axis.
- KLOW Peptide Blend: Complete Scientific Guide — The parent pillar article from which all cluster deep-dives derive. Covers the full blend rationale, component profiles, structural biology, pathway integration, analytical characterization, and research landscape.
Disclaimer: This article is intended exclusively for informational and research-context purposes. It does not constitute medical advice, product endorsement, or usage recommendation. The KLOW peptide blend (GHK-Cu, BPC-157, TB-500, KPV) has not been evaluated by the U.S. Food and Drug Administration (FDA), the European Medicines Agency (EMA), or any equivalent regulatory authority. All four component peptides and the co-lyophilized blend are classified and supplied exclusively as research chemicals for in vitro laboratory investigation — not as drugs, biologics, dietary supplements, or cosmetic ingredients. All statements regarding synergistic mechanisms, pathway interactions, and combinatorial effects are derived from individual peptide literature and biochemical principles, not from experimental data on the complete blend. No Chou-Talalay combination index data, isobolograms, or co-exposure studies exist for any KLOW peptide combination as of August 2026. Every synergy hypothesis presented herein should be interpreted as a provisional, falsifiable prediction that requires experimental validation. Researchers should consult appropriate institutional and regulatory guidelines before acquiring, handling, or using any peptide compound in laboratory investigations.